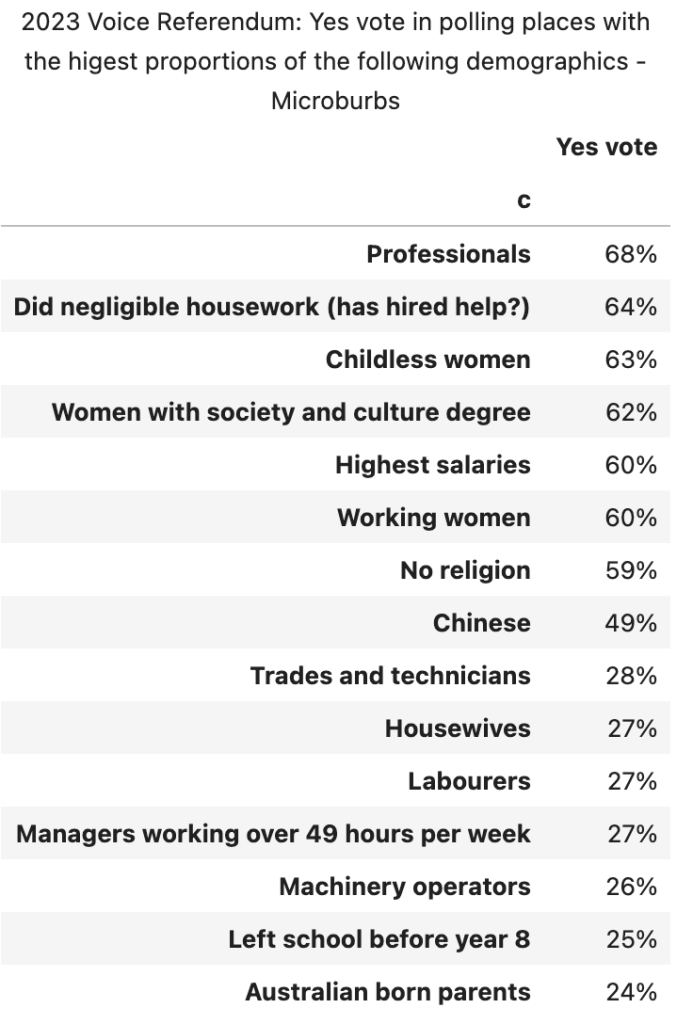
What kinds of Australians voted no? Worrying for Labor, its working class base overwhelmingly voted no. Broadly speaking, the educated and rich who do little housework voted Yes. Those who work closely with physical outcomes like managers, homemakers and labourers voted No.
In the below graph, I looked at the top 5% of the 6685 polling places we counted for each of these demographics – ones that have the most of these populations. There are some clear patterns.

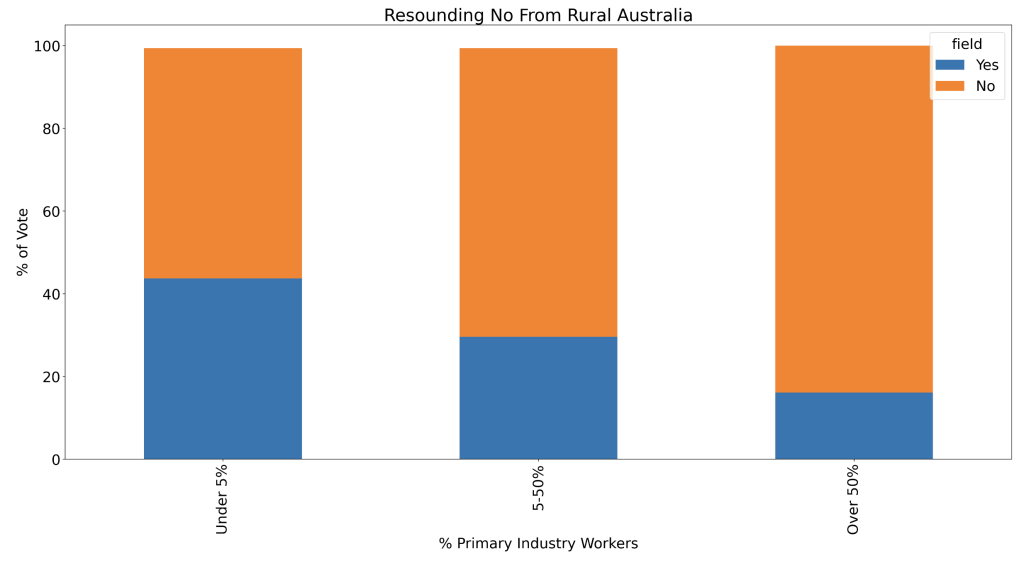
Primary industries:

These tend to be more conservative but may also feel their economic interests are threatened by native title.
The most yes votes were near polling places where somewhat less than half of the population was 3rd generation Australian. Where there were few native born Anglos (less than 22%), the Yes vote was similar to the national average at 42%.

More analysis to come.
Speak Your Mind