Real estate investment often presents a labyrinth of data and trends. Your ability to interpret these insights can significantly influence your decision-making success. This article unravels the power of quartile pricing analysis, a tactic that can instil confidence, enhance control, and guide your strategic decisions in the Australian property market.

Market Segmentation in Real Estate: Beyond Overall Median Sale Price
In real estate analysis, the overall median sale price of a suburb often dominates discussions. While it offers a snapshot, it doesn’t fully capture the diverse price dynamics within a suburb. This is where quartile analysis comes in. Quartiles break down the property market into distinct segments based on the Smart Median Sale Price, giving you a nuanced view of market dynamics. Recognising how each of these segments behave provides a comprehensive understanding of the market to shape your investment strategy.
Understanding the Top Quartile: Glimpses into the Premium Market
The top quartile encapsulates Australia’s premium housing market, a niche with unique behavioural patterns. An upswing in median sale prices within this segment could signal a growing demand for luxury properties, particularly evident during periods of positive overall economic conditions.
Understanding the Bottom Quartile: Unmasking Housing Affordability
Conversely, the bottom quartile represents the affordable housing sector. A quick surge in the median sale prices in this segment could signify intensified demand from first-time homebuyers or investors eyeing strong rental yields. Generally, the bottom segment of housing stock will continue to sell at the same pace irrespective of broader economic conditions. Monitoring these shifts helps you tap into investment opportunities that others might miss.
Unveiling Market Dynamics Through Quartile Analysis
Changes in quartiles over time expose crucial market dynamics that the overall median sale price fails to capture. For example, if the top quartile’s median sale prices are growing faster than the bottom quartile, it suggests that wealthier buyers are influencing property values. On the other hand, faster growth in the bottom quartile could signal a market shift towards more affordable housing. With this understanding, you can inform your investment strategy and foresee future market trends.
Quartile Analysis in Action: A Case Study from Sydney’s Housing Market
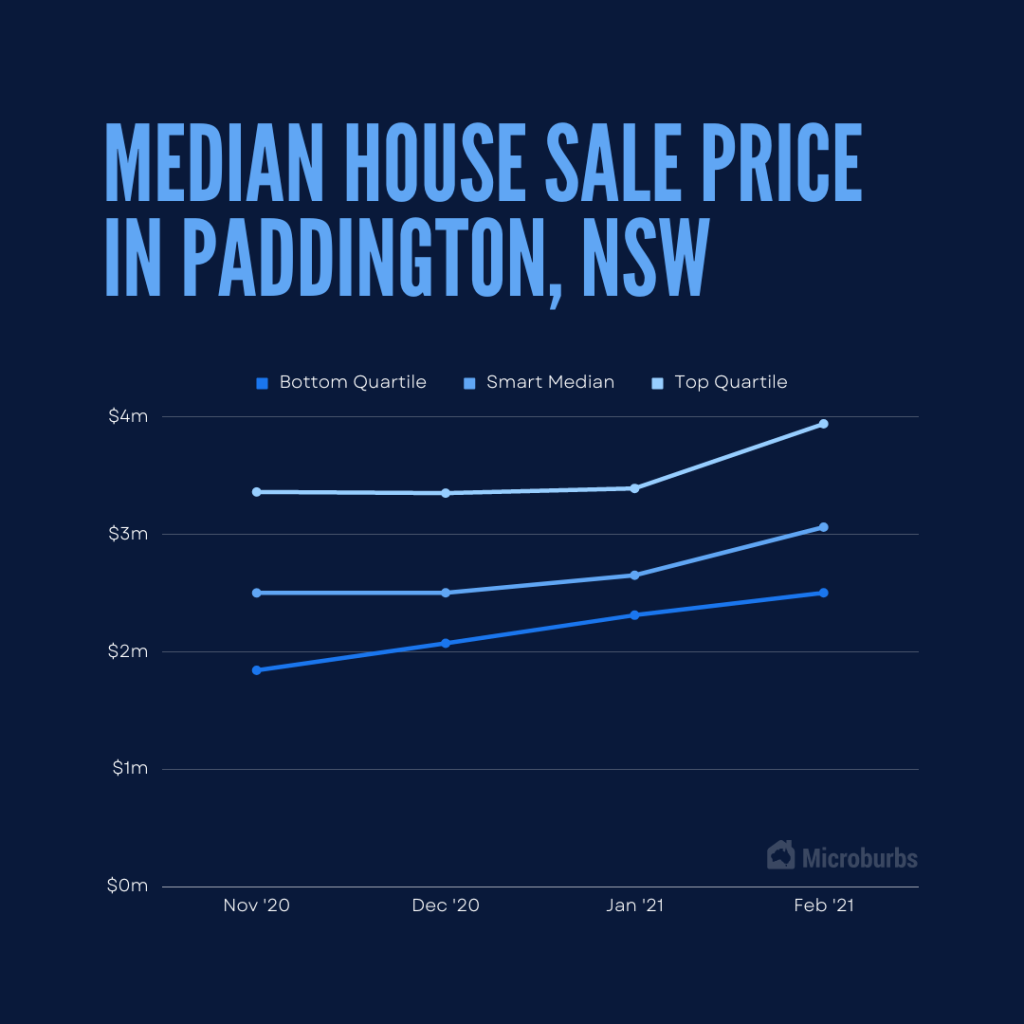
To illustrate the power of quartile analysis, let’s consider the property market of Paddington in Sydney. During the period from November 2020 to February 2021, the median house sale price grew by 22.4% from $2,500,000 to $3,060,000. If we look closer at the pricing quartiles, we can see the bottom quartile prices grew faster than the top quartile, signalling a shift in market dynamics towards more affordable properties. The bottom quartile grew by 35.86% from $1,840,000 to $2,500,000 while the top quartile only grew by 17.26% from $3,360,000 to $3,940,000. Savvy investors who noted this trend early would have capitalised on the changing market.

Beyond Quartiles: Other Key Metrics in Real Estate Analysis
While quartiles offer vital insights into price dispersion, they are part of a broader data landscape. Other factors, such as volume of houses sold and days on market, are also integral to the property buying process. Integrating these metrics with quartile analysis paints a comprehensive picture of the Australian housing market.
In the ever-changing Australian real estate market, analysing top and bottom quartiles of median sale prices is more than a statistical exercise. This tool not only helps you dissect market segmentation and track dynamics but also instils confidence and control in your investment decisions.
Speak Your Mind