RBA Pauses Cash Rate at 4.10% in August Meeting: What It Means for Homeowners and the Real Estate Market

In a highly anticipated move, the Reserve Bank of Australia (RBA) decided to maintain the cash rate at 4.10% during its August meeting. This decision comes after a series of aggressive rate increases, with the cash rate having risen by 400 basis points since May 2022, marking the most intense tightening cycle in modern history aimed at curbing inflationary pressures.

Economists had been divided on whether the RBA would continue its rate hike spree or take a pause. During July, over half of the economists surveyed (20 out of 36) predicted a 25 basis point increase in the official cash rate to 4.35%—a level not seen in nearly 12 years. As the announcement drew nearer, speculation was rife among major banks, with the Commonwealth Bank of Australia (CBA) and Westpac expecting a 25 basis point hike, while ANZ and NAB predicted a pause.

While the decision to hold the cash rate steady at 4.10% has come as a relief to some, it’s crucial to note that the central bank may not be done with rate adjustments. While the CBA expects the cash rate to peak at 4.35% before gradually easing to 3.10% by November 2024, Westpac and NAB both foresee a higher peak—4.60%—before a subsequent decline. Westpac estimates the peak to occur by September 2023, followed by a drop to 3.35% by May 2025, while NAB predicts a similar peak in September 2023, but with a lower drop to 3.10% by November 2024.

ANZ, which had initially forecasted a rate rise in July, remains cautious about abandoning its prediction of a 4.6% peak. The bank’s head of Australian economics, Adam Boyton, commented on the uncertainties following the RBA’s decision to pause, signalling that “the journey to the 4.6% level may not be straightforward”.

For the real estate market, these interest rate fluctuations can have significant implications. Homebuyers will need to keep a close eye on the market dynamics, as changes in interest rates can impact housing affordability and demand. As rates climb, borrowing costs can rise, potentially affecting property prices and the overall market sentiment. This pause in rate hikes might offer a temporary respite to buyers, allowing them some time to assess their options before the next potential increase.

The RBA’s decision has brought some relief to homeowners and borrowers. However, the future remains uncertain, as economists and major banks have differing opinions on where interest rates will peak.

Having accurate, up-to-date data is essential to navigate the ever-changing real estate market effectively. For the most current and comprehensive information about your suburb, explore Microburbs and get your free report today.

Invest with Certainty: Unlock Your Competitive Advantage in Australian Real Estate with Quartile Pricing Analysis

Real estate investment often presents a labyrinth of data and trends. Your ability to interpret these insights can significantly influence your decision-making success. This article unravels the power of quartile pricing analysis, a tactic that can instil confidence, enhance control, and guide your strategic decisions in the Australian property market.

Photo by Nicolas Gonzalez on Unsplash

Market Segmentation in Real Estate: Beyond Overall Median Sale Price

In real estate analysis, the overall median sale price of a suburb often dominates discussions. While it offers a snapshot, it doesn’t fully capture the diverse price dynamics within a suburb. This is where quartile analysis comes in. Quartiles break down the property market into distinct segments based on the Smart Median Sale Price, giving you a nuanced view of market dynamics. Recognising how each of these segments behave provides a comprehensive understanding of the market to shape your investment strategy.

Understanding the Top Quartile: Glimpses into the Premium Market

The top quartile encapsulates Australia’s premium housing market, a niche with unique behavioural patterns. An upswing in median sale prices within this segment could signal a growing demand for luxury properties, particularly evident during periods of positive overall economic conditions.

Understanding the Bottom Quartile: Unmasking Housing Affordability

Conversely, the bottom quartile represents the affordable housing sector. A quick surge in the median sale prices in this segment could signify intensified demand from first-time homebuyers or investors eyeing strong rental yields. Generally, the bottom segment of housing stock will continue to sell at the same pace irrespective of broader economic conditions. Monitoring these shifts helps you tap into investment opportunities that others might miss.

Unveiling Market Dynamics Through Quartile Analysis

Changes in quartiles over time expose crucial market dynamics that the overall median sale price fails to capture. For example, if the top quartile’s median sale prices are growing faster than the bottom quartile, it suggests that wealthier buyers are influencing property values. On the other hand, faster growth in the bottom quartile could signal a market shift towards more affordable housing. With this understanding, you can inform your investment strategy and foresee future market trends.

Quartile Analysis in Action: A Case Study from Sydney’s Housing Market

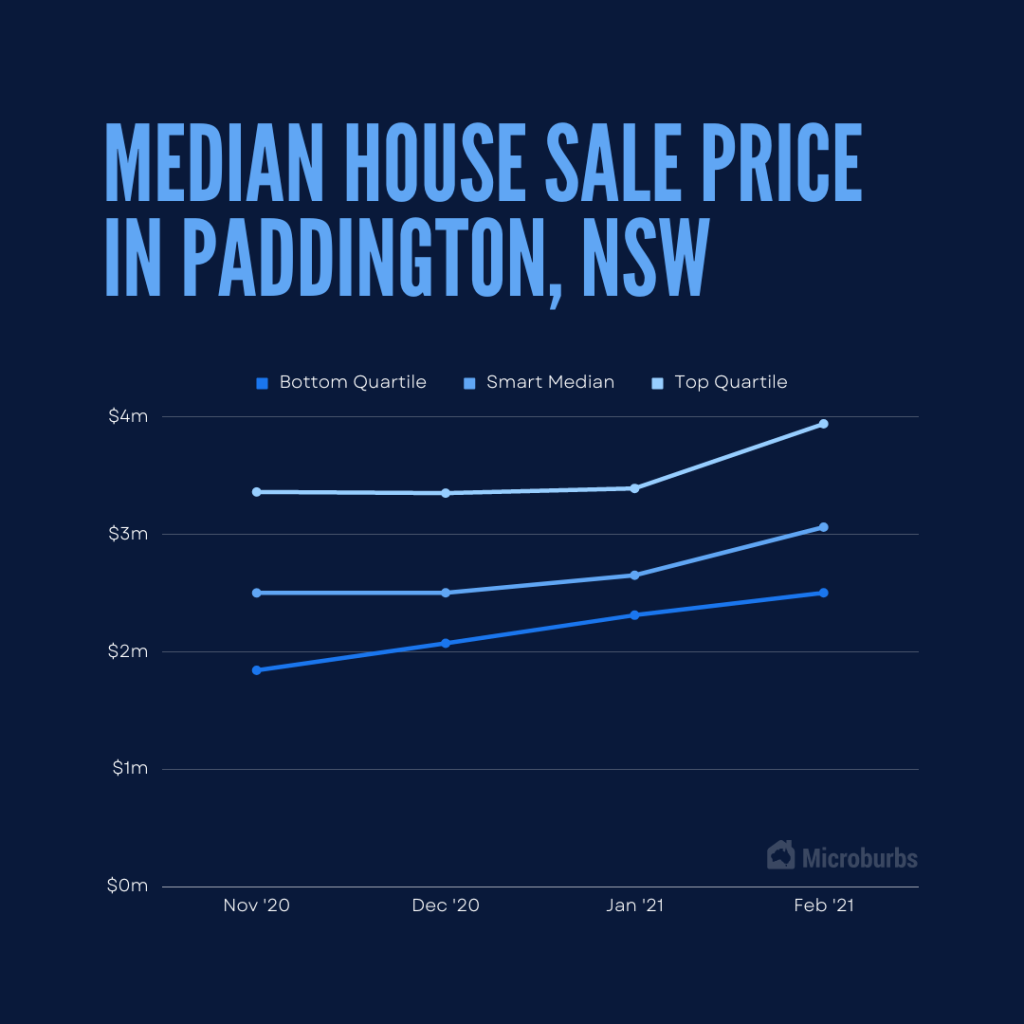
To illustrate the power of quartile analysis, let’s consider the property market of Paddington in Sydney. During the period from November 2020 to February 2021, the median house sale price grew by 22.4% from $2,500,000 to $3,060,000. If we look closer at the pricing quartiles, we can see the bottom quartile prices grew faster than the top quartile, signalling a shift in market dynamics towards more affordable properties. The bottom quartile grew by 35.86% from $1,840,000 to $2,500,000 while the top quartile only grew by 17.26% from $3,360,000 to $3,940,000. Savvy investors who noted this trend early would have capitalised on the changing market.

Median House Sale Price in Paddington, NSW

Beyond Quartiles: Other Key Metrics in Real Estate Analysis

While quartiles offer vital insights into price dispersion, they are part of a broader data landscape. Other factors, such as volume of houses sold and days on market, are also integral to the property buying process. Integrating these metrics with quartile analysis paints a comprehensive picture of the Australian housing market.

In the ever-changing Australian real estate market, analysing top and bottom quartiles of median sale prices is more than a statistical exercise. This tool not only helps you dissect market segmentation and track dynamics but also instils confidence and control in your investment decisions.

Mortgage Stress in Australian Real Estate: What You Need To Know

Are you prepared for the effect that mortgage stress can cause in the Australian real estate market? Whether you’re an experienced investor or an agent, it’s crucial to understand the intricate dance of factors at play within the property market, and mortgage stress is a significant part of that mix. This article pulls back the curtain on mortgage stress, revealing its hidden impacts on property values, shining a spotlight on the most affected suburbs, and underlining the vital importance of examining mortgage stress at the local-level.

Aerial view of outer suburb in Melbourne, Australia.
Photo by Tom Rumble on Unsplash

What is Mortgage Stress?

Mortgage stress is a financial situation where homeowners spend 30% or more of their pre-tax income on mortgage repayments. According to the Australian Bureau of Statistics, when housing costs exceed this threshold, households may struggle to afford other essential living costs. While the specific percentage can vary, this 30% figure is a commonly accepted benchmark. This stress can lead to financial hardship, and in severe cases, may result in the inability to meet mortgage payments, leading to foreclosure.

What Impact Does Mortgage Stress Have on Property Values?

Mortgage stress can have significant repercussions on property values and the broader real estate market. When a large number of homeowners experience mortgage stress, it increases the supply of properties on the market, as distressed homeowners may be forced to sell. This oversupply can lead to a decrease in property values.

For instance, the Global Financial Crisis in 2008 witnessed a surge in mortgage stress levels, causing a temporary dip in Australian property prices. The negative effect of mortgage stress on property values can create opportunities for savvy investors to snap up undervalued properties. However, it also introduces more uncertainty into the market, making careful risk assessment crucial.

Why is it Important to Look at Mortgage Stress on a LGA-Level?

Examining mortgage stress on an LGA-level provides granular insight into the local housing market conditions. Each LGA has unique economic factors, housing supply and demand, employment rates, and demographics influencing its mortgage stress levels.

For instance, an LGA with a high unemployment rate might experience increased mortgage stress levels in the future. This level of detail can enable property investors to make informed decisions. It helps in identifying potential risks and opportunities, understanding local market conditions, and devising effective investment strategies. Tools like Microburbs can help explore these specifics.

To deepen our understanding of mortgage stress and its implications on property investments, let’s take a look at three critical indicators provided by Microburbs. These metrics can empower investors and buyers agents with nuanced perspectives on mortgage stress at a granular level.

  • Mortgage as a Percent of Income: This metric represents the portion of a household’s pre-tax income used for mortgage repayments. It provides a snapshot of the potential affordability issues within a specific suburb.
  • Mortgage Non-Stress (LGA): This metric indicates the percentage of households within a Local Government Area (LGA) spending less than 30% of their pre-tax income on mortgage repayments. A higher percentage of non-stressed households can suggest a more stable real estate market, potentially making it a safer investment area.
  • Mortgage Stress (LGA): Conversely, this metric shows the percentage of households in an LGA spending more than 30% of their pre-tax income on mortgage repayments. Areas with high mortgage stress could be facing economic challenges or over-inflated property values. This could potentially create investment opportunities for savvy buyers or pose additional risks.

Annual Income Needed to Avoid Mortgage Stress in Capital Cities

Average income earners in Australia are unable to afford a house in a capital city without plunging into immediate mortgage stress. This table illustrates the annual household income needed to comfortably afford a house in various Australian capital cities. It’s calculated based on the most recent Smart Median Sale Prices and the standard variable interest rate.

Smart Median Sale PriceDeposit (20%)Monthly Repayments (6.44% Var. Rate)Annual Household Income needed to avoid Mortgage Stress (Pre-tax)
Sydney$1,940,000$388,000$9,749$680,133
Melbourne$1,460,000$292,000$7,337$498,667
Brisbane$1,040,000$208,000$5,227$339,920
Perth$782,000$156,400$3,930$242,340
Annual Income Needed to Avoid Mortgage Stress in Capital Cities, Microburbs

What Suburbs in Each State Experience the Greatest Mortgage Stress?

Mortgage stress varies across states and suburbs in Australia. Here are a few examples:

  • In New South Wales, Western Sydney suburbs like Villawood, Yennora and Granville have high levels of mortgage stress.
  • In Victoria, the outer suburbs of Melbourne, including Ravenhall and Woodstock, are significantly impacted.
  • In Queensland, Caboolture and its surrounding suburbs have reported higher mortgage stress levels.

Mortgage stress is a critical factor affecting the Australian real estate market. Understanding its impacts and how to mitigate its risks can provide investors and agents with a competitive edge. Always remember, thorough research and careful planning are keys to successful property investment in these complex market conditions.

Understanding Land-to-Asset Ratio: A Key to Australian Property Investment

Navigating the Australian real estate market can be a daunting task, but understanding key metrics like the land-to-asset ratio can guide your path to successful property investment. This post will provide insights into the importance of the land-to-asset ratio, how it’s calculated, and how it can impact your potential return on investment.

Aerial view of Melbourne, Australia during the daytime.
Photo by Pat Whelen on Unsplash

What is the land-to-asset ratio?

The land-to-asset ratio is a real estate valuation measure that compares the value of the land on which a property stands to the total value of the property – including the land, buildings, and any improvements. This ratio is particularly useful to property investors and agents as it helps determine the intrinsic value a piece of land holds in a property, thereby influencing its potential for appreciation and impact on returns.

How is the land-to-asset ratio calculated?

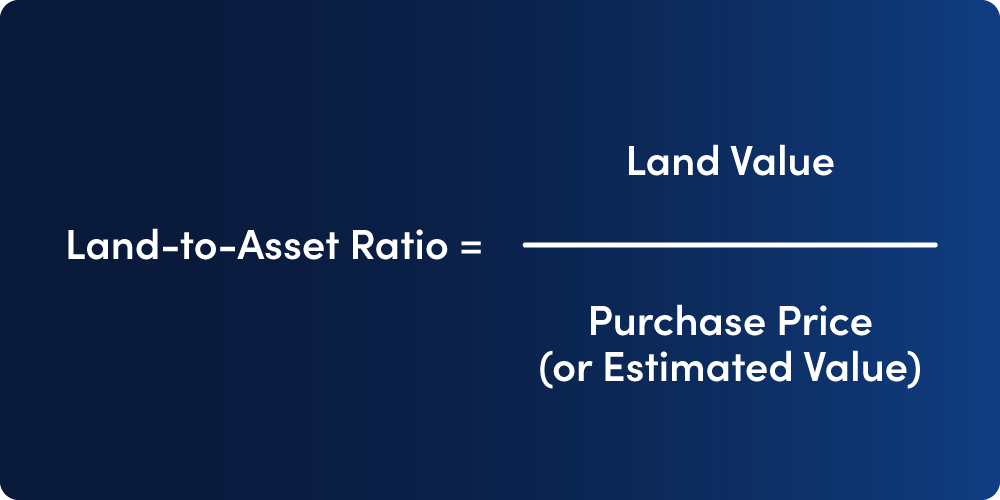
The formula for calculating the land-to-asset ratio is very straightforward:

Land-to-Asset Ratio = (Value of Land / Total Value of Property) x 100%

The formula for calculating land-to-asset ratio.

Consider two properties, both valued at $500,000, but with different land values:

Property AProperty B
Land Value$300,000$200,000
Purchase Price (or Estimated Value)$500,000$500,000
Land-to-Asset Ratio60%40%

Property A, with a higher land value, has a higher land-to-asset ratio. This higher ratio can potentially offer better capital growth prospects due to the inherent value of the land. However, as we will discuss further, the ideal ratio is influenced by various factors.

What is the ideal land-to-asset ratio?

While there’s no universal ‘magic number’, from an investment perspective, try to aim for an asset where the land represents at least 70% of the property’s value. In a pinch, don’t settle for anything below 50%. But remember, real estate isn’t a game of absolutes – the ‘perfect’ ratio depends on your unique financial goals, risk appetite, and market dynamics.

How does land-to-asset ratio impact the potential return on investment?

Land tends to appreciate over time, often at a faster pace than the value of the building or improvements. Therefore, a property with a higher land-to-asset ratio can potentially offer higher capital growth, leading to increased returns on investment. Furthermore, the potential for redevelopment or subdivision can also add to the investment’s value.

What are the drawbacks of properties with high land-to-asset ratios?

While properties with high land-to-asset ratios can offer more significant capital growth potential, they are not without their drawbacks. Firstly, such properties may have higher upfront costs, requiring a larger initial investment.

Additionally, because the value is tied more to the land, improvements or renovations to the property may not contribute significantly to its overall value. This might limit the profitability of value-adding strategies.

Compared to properties teeming with improvements, a high land-to-asset ratio property might also fetch you less rental income, potentially dampening your cash flow.

Modern two-storey home viewed from street level.
Photo by Brian Babb on Unsplash

How does the land-to-asset ratio impact the maintenance costs and depreciation of a property?

Properties with lower land-to-asset ratios often mean that a larger portion of the property’s value is tied to the building or improvements, which depreciate over time. These properties also come with higher maintenance costs. 

On the other hand, land, which contributes to a higher land-to-asset ratio, requires little to no maintenance, reducing the overall running costs.

How does the land-to-asset ratio vary across different property types and suburbs?

The land-to-asset ratio can significantly vary across different property types and suburbs. Detached houses often sport higher ratios than apartments or units, where you’re paying more for the building than the land. Similarly, the land-to-asset ratio can swing wildly from one suburb to another, juggling factors like proximity to the city centre, local amenities, and demand-supply dynamics. Luckily, tools like Microburbs can help you decode these local market dynamics.

Why Are Median and Quartile Land-to-Asset Ratios for a Suburb Relevant?

The median land-to-asset ratio for a suburb gives you a snapshot of the ‘average’ property landscape, acting as a key guide to inform your investment strategy. 

The 25% and 75% land-to-asset ratio quartiles add another layer to the story. They provide a more nuanced view of the property distribution, providing a framework for potential bargains and premium properties. A wide spread between these quartiles indicates greater variability in property types and potential investment strategies. A lower 25% quartile might indicate more affordable investment opportunities, while the 75% quartile can reflect properties with high land value – potential goldmines for capital growth.

In the end, understanding the land-to-asset ratio is like unlocking a secret level in the game of Australian real estate. Sure, it’s not the be-all and end-all, but combined with other factors such as location, market conditions, and your personal financial goals, it can be a game-changer.

Breaking News: RBA Announces Another Rate Hike, Sending Shockwaves through the Australian Economy

In breaking news, the Reserve Bank of Australia (RBA) has just announced another rate hike for June, increasing the cash rate by 25 basis points to 4.10%. The decision comes amidst concerns over high inflation and an overheating housing market, prompting the central bank to take action to rein in borrowing and spending.

This move comes as no surprise to analysts who have been closely watching the RBA’s policy decisions. The central bank has been signaling for some time that it may need to take action to cool down the economy, which has been running hot in recent months. With unemployment at a low rate of 3.7% and award wages set to rise 5.75% from July 1st, the board remains alert to the risks of ongoing high inflation.

In a statement, RBA Governor Philip Lowe said that the rate hike “is to provide greater confidence that inflation will return to target within a reasonable timeframe”. He noted that further rate hikes may be required in the coming months to ensure that inflation returns to target.

The decision has been met with mixed reactions, with some economists hailing it as a necessary step to curb inflation, while others warn of the potential negative impact on households and businesses.

The rate hike will have a significant impact on mortgage holders, with many borrowers set to face higher monthly repayments. The average Australian borrower will now be paying an additional $15,000 per year in repayments compared to 12 months ago.

Overall, the RBA’s decision to raise interest rates for the second time in as many months is a clear indication of the central bank’s determination to keep inflation under control. While the move is likely to have some short-term negative impacts on households and businesses, it is hoped that it will ultimately help to ensure a more stable and sustainable economic future for Australia.

Australian Property Market Rebounds as RBA Raises Cash Rate

In a surprise move defying investor expectations, the Reserve Bank of Australia (RBA) has raised its cash rate by 25 basis points to 3.85%. This is despite last week’s release of weaker-than-expected-inflation, which the RBA chose to overlook. The raise brings the cumulative increase to 3.75 percentage points and comes on top of 10 consecutive rises since last May.

RBA governor, Philip Lowe, stated that “Inflation in Australia has passed its peak, but at 7% is still too high and it will be some time yet before it is back in the target range.” He went on to say that given the importance of returning inflation to target, the board judged that a further increase in interest rates was warranted.

While some economists were surprised by the decision, the RBA was more focused on other factors such as the nation’s population expected to swell by 700,000 this year and next, a jobless rate at near half-century lows, and a rebound in the property market. The RBA also warned that there may be more interest rate hikes to come.

The announcement sent the Australian dollar soaring and shares plummeting, as investors weighed the impact of higher borrowing costs on companies.

The expected rise in the population and near half-century lows in jobless rates could result in increased demand for housing, further driving up property prices. However, it remains to be seen whether these factors will outweigh the potential negative impact of higher borrowing costs.

Despite the rate hike, the RBA’s expectation of a modest rise in GDP growth rate to “around 2%” by the 12 months to 2025 is unchanged from February.

While the rebound in property prices is a positive sign for homeowners and investors, the higher borrowing costs may result in a slowdown in the market. Investors and property owners should remain vigilant and consider the long-term impact of the RBA’s decision on their property portfolios.