Copyright Microburbs Pty Ltd 2014-
2025
.
Contact us
for licensing
Close
GET REPORT
New
Explorer
Profile Page
Logout
Sign Up
Login
Blog
Products
Subscriptions
Suburb Finder
Suburb Reports
Suburb DataExplorer
Free Data Consultation
API Access
Consulting Services
AI Property Finder
Coming Soon
Suburb Finder
2025 Suburb Reports
AI Property Finder
Profiles
People & Lifestyle
Crime & Disadvantage
Real Estate
Affluence & Economy
Environment
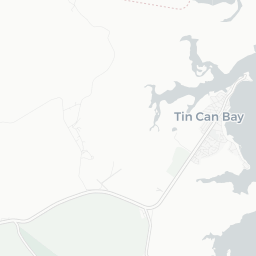
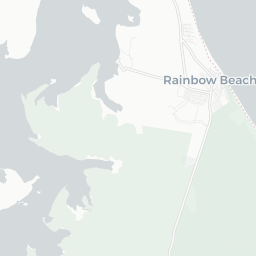
Nearby Suburbs
Cooloola Cove
Wallu
Tuan Forest
Toolara Forest
Cooloola
Tinnanbar
Inskip
Rainbow Beach
Fraser Island
Great Sandy Strait
Is Tin Can Bay QLD 4580 a rich suburb?
Affluence in Tin Can Bay
The higher the score, the more wealthy, high income and financially free the population is.
Sources: ABS, ATO, DSS, GOOGLE, TORREN and Microburbs, 2001 - 2023
Tin Can Bay
19.4%
Tin Can Bay
19.4%
Wide Bay
38.5%
Wide Bay
38.5%
Compare
Suburbs
Field
Value
VS Wide Bay
Trend
Education score
4.7
Bottom 24%
Data for Jun 2022
Middle Class
38.5%
Bottom 16%
Data for May 2023
Underclass
18.6%
Top 12%
Data for May 2023
Upper Class
4.9%
Bottom 39%
Data for May 2023
Working Class
38.0%
Top 21%
Data for May 2023
Austudy Payments (SA2)
5
Bottom 32%
Data for Jun 2024
Commonwealth Rent Assistance (SA2)
700
Top 26%
Data for Jun 2024
Median household income (weekly)
$734
Bottom 7%
26% to Jan 2021
Pension Payments (SA2)
2040
Top 9%
Data for Jun 2024
Unemployed
0.3%
Top 47%
46% to Dec 2021
Business in Tin Can Bay
The higher the score, the more vibrant and diverse the regional economy.
Sources: ABS, GOOGLE, TORREN and Microburbs, 2016 - 2023
Tin Can Bay
95.2%
Tin Can Bay
95.2%
Wide Bay
83.5%
Wide Bay
83.5%
Compare
Suburbs
Field
Value
VS Wide Bay
Trend
Business Activity
41.0
Bottom 25%
Data for May 2023
Industry Diversity
88.9
Top 39%
Data for May 2023
Employment in Tin Can Bay
Sources: ABS, AURIN, SEEK and Microburbs, 2006 - 2022
Field
Value
VS Wide Bay
Trend
Labour force participation
25.7%
Bottom 5%
4% to Dec 2021
Businesses (94)
Headline
Place
Datetime
Bay Auto Services
4/ 2 Scullett Dr
Cooloola Coast Cabinets
136 Emperor St
Cooloola Coast Tyre & Auto
LOT 8 Scullett Dr
K J Homes
6 Gympie Rd
SeaBreeze Kayaks
Unit 2/10 Scullett Dr
Affluence (3)
Headline
Place
Datetime
Tin Can Bay Country Club Inc
Kidd Straight
Loading entities ..
+
−
Leaflet
Subscribe
to see the map content. See samples:
Surry Hills (NSW)
St Kilda (Vic.)
Fortitude Valley
Kent Town
Northbridge (WA)
Darwin City
Glenorchy (Tas.)
Expand ↗️
Loading Choropleth Data
Min
Max
Subscribe
to see the timeline. See samples:
Surry Hills (NSW)
St Kilda (Vic.)
Fortitude Valley
Kent Town
Northbridge (WA)
Darwin City
Glenorchy (Tas.)
Profiles
People & Lifestyle
Crime & Disadvantage
Real Estate
Affluence & Economy
Environment
Nearby Suburbs
Cooloola Cove
Wallu
Tuan Forest
Toolara Forest
Cooloola
Tinnanbar
Inskip
Rainbow Beach
Fraser Island
Great Sandy Strait
.png)