Copyright Microburbs Pty Ltd 2014-
2025
.
Contact us
for licensing
Close
GET REPORT
New
Explorer
Profile Page
Logout
Sign Up
Login
Blog
Products
Subscriptions
Suburb Finder
Suburb Reports
Suburb DataExplorer
Free Data Consultation
API Access
Consulting Services
AI Property Finder
Coming Soon
Suburb Finder
2025 Suburb Reports
AI Property Finder
Profiles
People & Lifestyle
Crime & Disadvantage
Real Estate
Affluence & Economy
Environment
Nearby Suburbs
Phoenix Park
Brandy Hill
Hinton
Largs
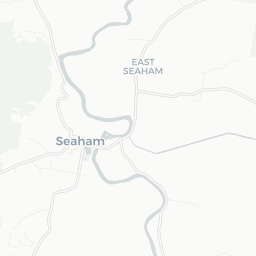
Seaham
Woodville (NSW)
Osterley (NSW)
Bolwarra Heights
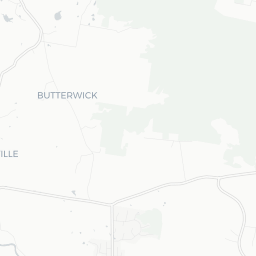
Butterwick
Morpeth
Is Wallalong NSW 2320 a rich suburb?
Affluence in Wallalong
The higher the score, the more wealthy, high income and financially free the population is.
Sources: ABS, ATO, DSS, GOOGLE, TORREN and Microburbs, 2001 - 2023
Wallalong
76.3%
Wallalong
76.3%
Hunter Valley exc Newcastle
54.1%
Hunter Valley exc Newcastle
54.1%
Compare
Suburbs
Field
Value
VS Hunter Valley exc Newcastle
Trend
Education score
5.6
Top 14%
5% to Jun 2022
Middle Class
50.0%
Bottom 45%
Data for May 2023
Underclass
13.3%
Top 46%
Data for May 2023
Upper Class
3.8%
Bottom 14%
Data for May 2023
Working Class
33.0%
Top 36%
Data for May 2023
Austudy Payments (SA2)
5
Bottom 32%
Data for Jun 2024
Commonwealth Rent Assistance (SA2)
80
Bottom 10%
Data for Jun 2024
Median household income (weekly)
$2,550
Top 7%
35% to Jan 2021
Pension Payments (SA2)
440
Bottom 24%
Data for Jun 2024
Unemployed
0.2%
Bottom 47%
21% to Dec 2021
Business in Wallalong
The higher the score, the more vibrant and diverse the regional economy.
Sources: ABS, GOOGLE, TORREN and Microburbs, 2016 - 2023
Wallalong
100.0%
Wallalong
100.0%
Hunter Valley exc Newcastle
82.5%
Hunter Valley exc Newcastle
82.5%
Compare
Suburbs
Field
Value
VS Hunter Valley exc Newcastle
Trend
Industry Diversity
100.0
Top 6%
Data for May 2023
Employment in Wallalong
Sources: ABS, AURIN, SEEK and Microburbs, 2006 - 2022
Field
Value
VS Hunter Valley exc Newcastle
Trend
Labour force participation
73.0%
Top 14%
37% to Dec 2021
Infrastructure (6)
Headline
Place
Datetime
All Septic Services
Businesses (22)
Headline
Place
Datetime
Karmel Farms Management
71 Mcclymonts Swamp Rd
Loading entities ..
+
−
Leaflet
Subscribe
to see the map content. See samples:
Surry Hills (NSW)
St Kilda (Vic.)
Fortitude Valley
Kent Town
Northbridge (WA)
Darwin City
Glenorchy (Tas.)
Affluence: Education score
Expand ↗️
Loading choropleth for Education score
Min
Max
Subscribe
to see the timeline. See samples:
Surry Hills (NSW)
St Kilda (Vic.)
Fortitude Valley
Kent Town
Northbridge (WA)
Darwin City
Glenorchy (Tas.)
Profiles
People & Lifestyle
Crime & Disadvantage
Real Estate
Affluence & Economy
Environment
Nearby Suburbs
Phoenix Park
Brandy Hill
Hinton
Largs
Seaham
Woodville (NSW)
Osterley (NSW)
Bolwarra Heights
Butterwick
Morpeth
.png)