Copyright Microburbs Pty Ltd 2014-
2025
.
Contact us
for licensing
Close
GET REPORT
New
Explorer
Profile Page
Logout
Sign Up
Login
Blog
Products
Subscriptions
Suburb Finder
Suburb Reports
Suburb DataExplorer
Free Data Consultation
API Access
Consulting Services
AI Property Finder
Coming Soon
Suburb Finder
2025 Suburb Reports
AI Property Finder
Profiles
People & Lifestyle
Crime & Disadvantage
Real Estate
Affluence & Economy
Environment
Nearby Suburbs
Pallamallawa
Terry Hie Hie
Warialda Rail
Warialda
Bangheet
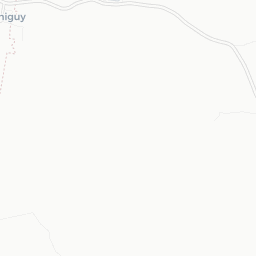
Biniguy
Elcombe
Gineroi
Berrigal
Rocky Creek (Gwydir - NSW)
Is Gravesend NSW 2401 peaceful and clean? (Natural Environment, Pollution and Noise)
Tranquility Score in Gravesend
Gravesend Noise Heat Map
Sample Graphic
The higher the score, the more peaceful and natureful a suburb is.
Sources: GEOSPATIAL, ABS and Microburbs, 2011 - 2023
Gravesend
86.0
Gravesend
86.0
New England and North West
82.2
New England and North West
82.2
Compare
Suburbs
Field
Value
VS New England and North West
Trend
Parkland proportion
0%
Bottom 12%
Data for Jan 2021
Residential density
6400 sqm per resident
Top 22%
Data for Jan 2021
Climate Score in Gravesend
The proportion of pleasant days in an average year (moderate temperature, sunlight and low humidity).
Sources: BOM and Microburbs, 2023
Gravesend
74.4
Gravesend
74.4
New England and North West
57.1
New England and North West
57.1
Compare
Suburbs
Field
Value
VS New England and North West
Trend
Maximum Humidity: Annual
79.0%
Bottom 5%
Data for Jan 2023
Maximum Temperature: Annual
27.0 °C
Top 16%
Data for Jan 2023
Rainfall (average daily): Annual
1.4mm
Bottom 25%
Data for Jan 2023
Solar Radiation: Annual
20.0MJ/sq m
Top 15%
Data for Jan 2023
Wind Speed: Annual
4.3m/sec
Top 30%
Data for Jan 2023
Risk in Gravesend
Gravesend Risk Report
Sample Graphic
The proportion of suburb officially designated as at environmental risk including bushfires, landslides and flooding.
Sources: GEOSPATIAL and Microburbs, 2023
Gravesend
91.6%
Gravesend
91.6%
New England and North West
84.9%
New England and North West
84.9%
Compare
Suburbs
Field
Value
VS New England and North West
Trend
Flood planning area proportion
0.0%
Bottom 40%
Data for Jun 2023
Flood prone area proportion
0.0%
Bottom 49%
Data for Jun 2023
Median earthquake hazard risk
0.0
Bottom 43%
Data for Jun 2023
Energy Efficiency in Gravesend
High scores mean lower costs/carbon emissions to cool, heat the homes in the area.
Sources: TORREN, BASIX and Microburbs, 2012 - 2023
Gravesend
38.0%
Gravesend
38.0%
New England and North West
38.2%
New England and North West
38.2%
Compare
Suburbs
Field
Value
VS New England and North West
Trend
Energy Score
38.0
Bottom 10%
Data for Dec 2015
Water Score
Premium
Premium
Premium
Loading entities ..
+
−
Leaflet
Subscribe
to see the map content. See samples:
Surry Hills (NSW)
St Kilda (Vic.)
Fortitude Valley
Kent Town
Northbridge (WA)
Darwin City
Glenorchy (Tas.)
Expand ↗️
Loading Choropleth Data
Min
Max
Subscribe
to see the timeline. See samples:
Surry Hills (NSW)
St Kilda (Vic.)
Fortitude Valley
Kent Town
Northbridge (WA)
Darwin City
Glenorchy (Tas.)
Profiles
People & Lifestyle
Crime & Disadvantage
Real Estate
Affluence & Economy
Environment
Nearby Suburbs
Pallamallawa
Terry Hie Hie
Warialda Rail
Warialda
Bangheet
Biniguy
Elcombe
Gineroi
Berrigal
Rocky Creek (Gwydir - NSW)
.png)