Copyright Microburbs Pty Ltd 2014-
2025
.
Contact us
for licensing
Close
GET REPORT
New
Explorer
Profile Page
Logout
Sign Up
Login
Blog
Products
Subscriptions
Suburb Finder
Suburb Reports
Suburb DataExplorer
Free Data Consultation
API Access
Consulting Services
AI Property Finder
Coming Soon
Suburb Finder
2025 Suburb Reports
AI Property Finder
Profiles
People & Lifestyle
Crime & Disadvantage
Real Estate
Affluence & Economy
Environment
Nearby Suburbs
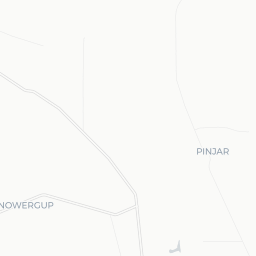
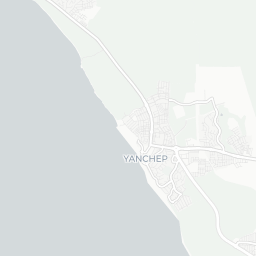
Yanchep
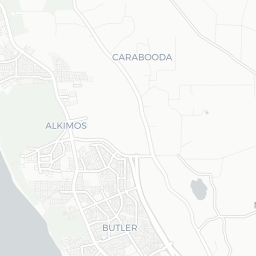
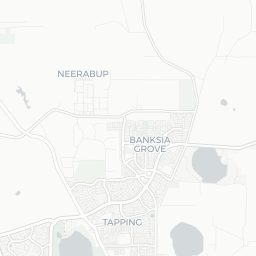
Banksia Grove
Nowergup
Neerabup
Mariginiup
Tapping
Carramar (WA)
Jandabup
Carabooda
Ashby (WA)
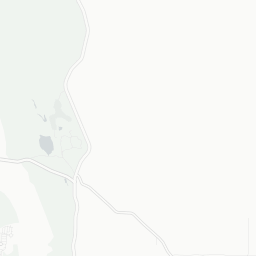
Is Pinjar WA 6078 peaceful and clean? (Natural Environment, Pollution and Noise)
Climate Score in Pinjar
The proportion of pleasant days in an average year (moderate temperature, sunlight and low humidity).
Sources: BOM, TORREN and Microburbs, 2022 - 2023
Pinjar
59.0
Pinjar
59.0
Perth
62.5
Perth
62.5
Compare
Suburbs
Field
Value
VS Perth
Trend
Maximum Humidity: Annual
87.0%
Bottom 26%
Data for Jan 2023
Maximum Temperature: Annual
26.0 °C
Top 25%
Data for Jan 2023
Rainfall (average daily): Annual
1.8mm
Bottom 42%
Data for Jan 2023
Solar Radiation: Annual
20.0MJ/sq m
Top 19%
Data for Jan 2023
Wind Speed: Annual
4.3m/sec
Top 34%
Data for Jan 2023
Risk in Pinjar
Pinjar Risk Report
Sample Graphic
The proportion of suburb officially designated as at environmental risk including bushfires, landslides and flooding.
Sources: GEOSPATIAL and Microburbs, 2023
Pinjar
92.6%
Pinjar
92.6%
Perth
67.3%
Perth
67.3%
Compare
Suburbs
Field
Value
VS Perth
Trend
Median earthquake hazard risk
0.0
Bottom 43%
Data for Jun 2023
Loading entities ..
+
−
Leaflet
Subscribe
to see the map content. See samples:
Surry Hills (NSW)
St Kilda (Vic.)
Fortitude Valley
Kent Town
Northbridge (WA)
Darwin City
Glenorchy (Tas.)
Expand ↗️
Loading Choropleth Data
Min
Max
Subscribe
to see the timeline. See samples:
Surry Hills (NSW)
St Kilda (Vic.)
Fortitude Valley
Kent Town
Northbridge (WA)
Darwin City
Glenorchy (Tas.)
Profiles
People & Lifestyle
Crime & Disadvantage
Real Estate
Affluence & Economy
Environment
Nearby Suburbs
Yanchep
Banksia Grove
Nowergup
Neerabup
Mariginiup
Tapping
Carramar (WA)
Jandabup
Carabooda
Ashby (WA)
.png)