.png)
Profiles
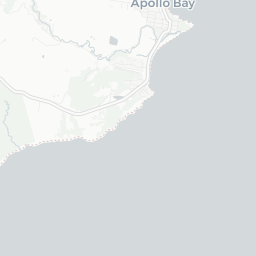
Nearby Suburbs
What Kind of People Live in Apollo Bay (Vic.) VIC 3233?
Diversity Levels in Apollo Bay (Vic.)
The proportion of the population who are not 3rd+ generation Anglo-Australians
Sources: ABS and Microburbs, 2006 - 2023
Sources: ABS and Microburbs, 2006 - 2023
Apollo Bay (Vic.)
24.5%
Apollo Bay (Vic.)
24.5%
Warrnambool and South West
13.5%
Warrnambool and South West
13.5%
| Field | Value | VS Warrnambool and South West | Trend | |
|---|---|---|---|---|
| 52 | Top 22% |
|
||
| 1.5% | Top 46% |
|
||
| 24.2% | Top 26% |
|
Quality of Life in Apollo Bay (Vic.)

The proportion of residents who enjoy a healthy, satisfying life.
Sources: ABS, DSS, GEOSPATIAL, GOOGLE, TORREN and Microburbs, 2006 - 2023
Sources: ABS, DSS, GEOSPATIAL, GOOGLE, TORREN and Microburbs, 2006 - 2023
Apollo Bay (Vic.)
71.6%
Apollo Bay (Vic.)
71.6%
Warrnambool and South West
72.8%
Warrnambool and South West
72.8%
| Field | Value | VS Warrnambool and South West | Trend | |
|---|---|---|---|---|
| 8 | Top 35% | Data for Jun 2023 | ||
| 79 | Top 38% | Data for Dec 2016 | ||
| 85.0 | Top 1% | Data for May 2023 | ||
Conservatism in Apollo Bay (Vic.)
The proportion of the population who hold traditional values.
Sources: ABS, AEC and Microburbs, 2006 - 2023
Sources: ABS, AEC and Microburbs, 2006 - 2023
Apollo Bay (Vic.)
22.0%
Apollo Bay (Vic.)
22.0%
Warrnambool and South West
32.3%
Warrnambool and South West
32.3%
| Field | Value | VS Warrnambool and South West | Trend | |
|---|---|---|---|---|
| 41.0% | Bottom 14% | Data for May 2023 | ||
| 88.5% | Top 38% | 0 to Jan 2021 | ||
| 33.4% | Bottom 13% | Data for Dec 2022 |
Convenience Score in Apollo Bay (Vic.)

The higher the score, the faster the travel time to regular amenities like work and shopping and the easier it is to access them without private cars.
Sources: ABS, GEOSPATIAL and Microburbs, 2006 - 2023
Sources: ABS, GEOSPATIAL and Microburbs, 2006 - 2023
Apollo Bay (Vic.)
75.0
Apollo Bay (Vic.)
75.0
Warrnambool and South West
67.4
Warrnambool and South West
67.4
| Field | Value | VS Warrnambool and South West | Trend | |
|---|---|---|---|---|
| 0.0% | Bottom 35% | Data for Dec 2021 | ||
| 1.6 | Bottom 24% | Data for Jan 2021 | ||
| 2.3% | Top 2% |
|
||
| 44 km | Top 43% | Data for Mar 2023 | ||
| 16.9% | Top 8% |
|
Hip Score in Apollo Bay (Vic.)
The higher the score, the more fashionable and lively an area is: a trendy, progressive population with easy access to nightlife and culture.
Sources: ABS, AEC, GOOGLE and Microburbs, 2006 - 2023
Sources: ABS, AEC, GOOGLE and Microburbs, 2006 - 2023
Apollo Bay (Vic.)
72.0
Apollo Bay (Vic.)
72.0
Warrnambool and South West
60.1
Warrnambool and South West
60.1
| Field | Value | VS Warrnambool and South West | Trend | |
|---|---|---|---|---|
| 61% | Bottom 46% | Data for Nov 2017 | ||
| 59.2% | Top 15% |
|
||
| 4.5% | Top 19% |
|
||
| 54.0% | Top 14% |
|
||
| 39.6% | Top 30% | Data for Dec 2022 | ||
| 0.6% | Top 6% |
|
Community Score in Apollo Bay (Vic.)
The higher the score, the more time residents spend contributing the local community and the more connected residents are to their community.
Sources: ABS, GOOGLE, TORREN and Microburbs, 2006 - 2023
Sources: ABS, GOOGLE, TORREN and Microburbs, 2006 - 2023
Apollo Bay (Vic.)
92.0
Apollo Bay (Vic.)
92.0
Warrnambool and South West
87.5
Warrnambool and South West
87.5
| Field | Value | VS Warrnambool and South West | Trend | |
|---|---|---|---|---|
| 96.1% | Top 10% | Data for Dec 2014 | ||
| 49.5% | Top 23% |
|
Family Score in Apollo Bay (Vic.)
The higher the score, the more suitable the suburb is to families with children: good schools, safe, plentiful families, child-friendly amenities like playgrounds
Sources: ABS, DSS, TORREN and Microburbs, 2006 - 2023
Sources: ABS, DSS, TORREN and Microburbs, 2006 - 2023
Apollo Bay (Vic.)
87.0
Apollo Bay (Vic.)
87.0
Warrnambool and South West
71.1
Warrnambool and South West
71.1
| Field | Value | VS Warrnambool and South West | Trend | |
|---|---|---|---|---|
| 50 | Bottom 43% | Data for Dec 2022 | ||
| 24 | Bottom 7% | Data for Dec 2022 | ||
| 58.3% | Bottom 21% |
|
||
| 2.8% | Bottom 42% |
|
||
| Premium | Premium | Premium |
Health Services (10)
| Name | Address |
|---|---|
| Caterina Morrison ND | 485 Great Ocean Rd, Apollo Bay VIC 3233, Australia |
| Apollo Bay Medical Centre | 75 McLachlan St, Apollo Bay VIC 3233, Australia |
| Apollo Bay Medical Centre | 75, McLachlan St |
| Apollo Bay Medical Centre | 75, McLachlan St |
| Apollo Bay General Practice | 75, McLachlan St |
Businesses (21)
| Name | Address |
|---|---|
| Memorable Makeovers | |
| Contemporary Kitchens & Glass P/L | 7, Oak Ave |
| Apollo Bay Building Group Pty Ltd | Lot 10/ Oak Ave |
| Memorable Makeovers | |
| Barham Valley Nursery | Conns Lane |
Tourism (1)
| Name | Address |
|---|---|
| Great Ocean Road Visitor Information Centre |
Recreational Facilities (9)
| Name | Address |
|---|---|
| Apollo Bay Recreation Reserve Camping Park | 70, Great Ocean Rd |
| BIG4 Apollo Bay Pisces Holiday Park | 311, Great Ocean Rd |
| Apollo Bay Building Group Pty Ltd | Lot 10/ Oak Ave |
| Apollo Bay Fishing & Adventure Tours | Apollo Bay Harbour |
| Apollo Bay Fishing & Adventures |
Community Groups (1)
| Name | Address |
|---|---|
| Otway Health & Community Services |
Education (2)
| Name | Address |
|---|---|
| Apollo Bay Child Care Centre | 4, Pengilley Ave |
| Apollo Bay Child Care Centre | 4, Pengilley Ave |
Venues and Restaurants (4)
| Name | Address |
|---|---|
| Apollo Bay Fishermens Co-Op | 2, Breakwater Rd |
| Apollo Bay Fishermens Co-Op | 2, Breakwater Rd |
| Dooleys Ice Cream | 89, Great Ocean Rd |
| Apollo Bay Fishermens Co-Op | 2, Breakwater Rd |
Loading entities ..