.png)
Profiles
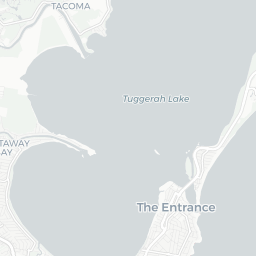
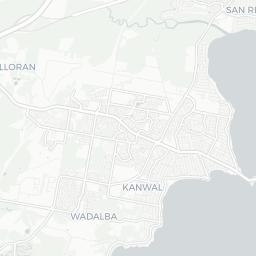
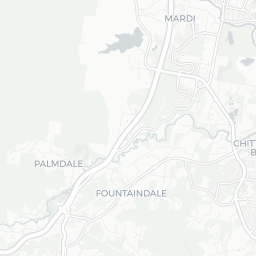
Nearby Suburbs
What Kind of People Live in Chittaway Point NSW 2261?
Diversity Levels in Chittaway Point
The proportion of the population who are not 3rd+ generation Anglo-Australians
Sources: ABS and Microburbs, 2006 - 2023
Sources: ABS and Microburbs, 2006 - 2023
Chittaway Point
25.3%
Chittaway Point
25.3%
Central Coast NSW
25.7%
Central Coast NSW
25.7%
| Field | Value | VS Central Coast NSW | Trend | |
|---|---|---|---|---|
| 44 | Bottom 48% |
|
||
| 7.3% | Top 12% |
|
||
| 19.3% | Top 37% |
|
Quality of Life in Chittaway Point

The proportion of residents who enjoy a healthy, satisfying life.
Sources: ABS, AIHW, DSS, GEOSPATIAL, GOOGLE, TORREN and Microburbs, 2006 - 2023
Sources: ABS, AIHW, DSS, GEOSPATIAL, GOOGLE, TORREN and Microburbs, 2006 - 2023
Chittaway Point
71.6%
Chittaway Point
71.6%
Central Coast NSW
70.4%
Central Coast NSW
70.4%
| Field | Value | VS Central Coast NSW | Trend | |
|---|---|---|---|---|
| 26 | Top 11% | Data for Jun 2023 | ||
| 79 | Bottom 48% | Data for Dec 2016 | ||
| 73.0 | Bottom 43% | Data for May 2023 | ||
Conservatism in Chittaway Point
The proportion of the population who hold traditional values.
Sources: ABS, AEC and Microburbs, 2006 - 2023
Sources: ABS, AEC and Microburbs, 2006 - 2023
Chittaway Point
45.0%
Chittaway Point
45.0%
Central Coast NSW
33.9%
Central Coast NSW
33.9%
| Field | Value | VS Central Coast NSW | Trend | |
|---|---|---|---|---|
| 61.0% | Top 37% | Data for May 2023 | ||
| 82.7% | Bottom 46% |
|
||
| 56.0% | Top 39% | Data for Dec 2022 |
Convenience Score in Chittaway Point

The higher the score, the faster the travel time to regular amenities like work and shopping and the easier it is to access them without private cars.
Sources: ABS, GEOSPATIAL, GEOSERVER and Microburbs, 2006 - 2023
Sources: ABS, GEOSPATIAL, GEOSERVER and Microburbs, 2006 - 2023
Chittaway Point
75.0
Chittaway Point
75.0
Central Coast NSW
74.2
Central Coast NSW
74.2
| Field | Value | VS Central Coast NSW | Trend | |
|---|---|---|---|---|
| 0.0% | Bottom 35% |
|
||
| 2.1 | Top 44% |
|
||
| 0.0% | Bottom 38% |
|
||
| 55 km | Top 35% | Data for Mar 2023 | ||
| 0.0% | Bottom 19% | Data for Dec 2021 |
Hip Score in Chittaway Point
The higher the score, the more fashionable and lively an area is: a trendy, progressive population with easy access to nightlife and culture.
Sources: ABS, AEC, GOOGLE and Microburbs, 2006 - 2023
Sources: ABS, AEC, GOOGLE and Microburbs, 2006 - 2023
Chittaway Point
60.0
Chittaway Point
60.0
Central Coast NSW
60.5
Central Coast NSW
60.5
| Field | Value | VS Central Coast NSW | Trend | |
|---|---|---|---|---|
| 66% | Top 28% | Data for Nov 2017 | ||
| 5 | Top 27% | Data for Aug 2023 | ||
| 0.0 | Bottom 43% | Data for May 2023 | ||
| 39.3% | Bottom 34% |
|
||
| 2.5% | Top 33% |
|
||
| 45.0% | Bottom 44% |
|
||
| 36.5% | Top 35% | Data for Dec 2022 | ||
| 0.0% | Bottom 37% | Data for Jan 2021 |
Community Score in Chittaway Point
The higher the score, the more time residents spend contributing the local community and the more connected residents are to their community.
Sources: ABS, GOOGLE and Microburbs, 2006 - 2023
Sources: ABS, GOOGLE and Microburbs, 2006 - 2023
Chittaway Point
91.0
Chittaway Point
91.0
Central Coast NSW
87.3
Central Coast NSW
87.3
| Field | Value | VS Central Coast NSW | Trend | |
|---|---|---|---|---|
| 0.0 | Bottom 31% | Data for May 2023 | ||
| 25.9% | Bottom 31% |
|
Family Score in Chittaway Point
The higher the score, the more suitable the suburb is to families with children: good schools, safe, plentiful families, child-friendly amenities like playgrounds
Sources: ABS, DSS and Microburbs, 2006 - 2023
Sources: ABS, DSS and Microburbs, 2006 - 2023
Chittaway Point
75.0
Chittaway Point
75.0
Central Coast NSW
74.9
Central Coast NSW
74.9
| Field | Value | VS Central Coast NSW | Trend | |
|---|---|---|---|---|
| 77.7% | Top 36% |
|
||
| 2.5% | Bottom 40% |
|
||
| Premium | Premium | Premium |
Venues and Restaurants (1)
| Headline | Place | Datetime |
|---|---|---|
| Chittaway Bay Tavern | Chittaway Rd |
Health Services (5)
| Headline | Place | Datetime |
|---|---|---|
| Essential Balance | 232 Geoffrey Rd | |
| Yoga & You | ||
Education (4)
| Name | Address |
|---|---|
| Towermusic | 45 Geoffrey Rd, Chittaway Point NSW 2261, Australia |
| NextGen Tutoring | |
| NextGen Tutoring | |
| Tower Music | 45, Geoffrey Rd |
Businesses (2)
| Name | Address |
|---|---|
| Swish Salon Supplies | 132, Geoffrey Rd |
| Endangered Photos Restoration | 15, Henry St |
Recreational Facilities (1)
| Name | Address |
|---|---|
| Yoga & You |
Loading entities ..