.png)
Profiles
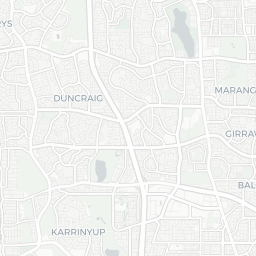
Nearby Suburbs
What Kind of People Live in Duncraig WA 6023?
Diversity Levels in Duncraig
The proportion of the population who are not 3rd+ generation Anglo-Australians
Sources: ABS, TORREN and Microburbs, 2006 - 2023
Sources: ABS, TORREN and Microburbs, 2006 - 2023
Duncraig
34.9%
Duncraig
34.9%
Perth
44.8%
Perth
44.8%
| Field | Value | VS Perth | Trend | |
|---|---|---|---|---|
| 42 | Bottom 39% |
|
||
| Premium | Premium | Premium | ||
| Premium | Premium | Premium | ||
| 0.4% | Bottom 42% |
|
||
| 42.8% | Top 9% |
|
Quality of Life in Duncraig

The proportion of residents who enjoy a healthy, satisfying life.
Sources: ABS, AIHW, DSS, GEOSPATIAL, GOOGLE, TORREN and Microburbs, 2006 - 2045
Sources: ABS, AIHW, DSS, GEOSPATIAL, GOOGLE, TORREN and Microburbs, 2006 - 2045
Duncraig
73.0%
Duncraig
73.0%
Perth
74.4%
Perth
74.4%
| Field | Value | VS Perth | Trend | |
|---|---|---|---|---|
| 24 | Top 13% | Data for Jun 2023 | ||
| 80 | Top 27% | Data for Dec 2016 | ||
| 77.0 | Top 24% | Data for May 2023 | ||
| 46.0 | Top 12% | Data for May 2023 | ||
| 99.6% | Top 2% | Data for May 2023 | ||
| Premium | Premium | Premium |
Conservatism in Duncraig
The proportion of the population who hold traditional values.
Sources: ABS, AEC and Microburbs, 2006 - 2023
Sources: ABS, AEC and Microburbs, 2006 - 2023
Duncraig
28.3%
Duncraig
28.3%
Perth
28.1%
Perth
28.1%
| Field | Value | VS Perth | Trend | |
|---|---|---|---|---|
| 51.0% | Bottom 37% | Data for May 2023 | ||
| 86.2% | Top 44% |
|
||
| 44.4% | Bottom 35% | Data for Dec 2022 |
Convenience Score in Duncraig

The higher the score, the faster the travel time to regular amenities like work and shopping and the easier it is to access them without private cars.
Sources: ABS, GEOSPATIAL, TORREN, GEOSERVER and Microburbs, 2006 - 2045
Sources: ABS, GEOSPATIAL, TORREN, GEOSERVER and Microburbs, 2006 - 2045
Duncraig
77.0
Duncraig
77.0
Perth
76.5
Perth
76.5
| Field | Value | VS Perth | Trend | |
|---|---|---|---|---|
| 2.6% | Top 5% |
|
||
| 2.1 | Top 48% |
|
||
| 0.8% | Top 10% |
|
||
| 16 km | Bottom 27% | Data for Mar 2023 | ||
| 0.9% | Bottom 45% |
|
Hip Score in Duncraig
The higher the score, the more fashionable and lively an area is: a trendy, progressive population with easy access to nightlife and culture.
Sources: ABS, AEC, GOOGLE and Microburbs, 2006 - 2023
Sources: ABS, AEC, GOOGLE and Microburbs, 2006 - 2023
Duncraig
63.0
Duncraig
63.0
Perth
62.0
Perth
62.0
| Field | Value | VS Perth | Trend | |
|---|---|---|---|---|
| 68% | Top 23% | Data for Nov 2017 | ||
| 19 | Top 10% | Data for Aug 2023 | ||
| 0.0 | Bottom 43% | Data for May 2023 | ||
| 48.6% | Top 40% |
|
||
| 5.7% | Top 14% |
|
||
| 38.0% | Bottom 20% |
|
||
| 46.6% | Top 20% | Data for Dec 2022 | ||
| 0.0% | Top 25% |
|
Community Score in Duncraig
The higher the score, the more time residents spend contributing the local community and the more connected residents are to their community.
Sources: ABS, GOOGLE and Microburbs, 2006 - 2023
Sources: ABS, GOOGLE and Microburbs, 2006 - 2023
Duncraig
94.0
Duncraig
94.0
Perth
86.5
Perth
86.5
| Field | Value | VS Perth | Trend | |
|---|---|---|---|---|
| 2.0 | Top 17% | Data for May 2023 | ||
| 96.3% | Top 4% | Data for Dec 2014 | ||
| 40.8% | Top 36% |
|
Family Score in Duncraig
The higher the score, the more suitable the suburb is to families with children: good schools, safe, plentiful families, child-friendly amenities like playgrounds
Sources: ABS, DSS, TORREN and Microburbs, 2006 - 2023
Sources: ABS, DSS, TORREN and Microburbs, 2006 - 2023
Duncraig
92.0
Duncraig
92.0
Perth
77.6
Perth
77.6
| Field | Value | VS Perth | Trend | |
|---|---|---|---|---|
| 50 | Bottom 43% | Data for Dec 2022 | ||
| 150 | Top 42% | Data for Dec 2022 | ||
| 2000 | Top 9% |
|
||
| 81.8% | Top 25% |
|
||
| 4.4% | Top 39% |
|
||
| Premium | Premium | Premium |
Health Services (89)
| Headline | Place | Datetime |
|---|---|---|
| 1st Dental | 85 Warwick Rd | |
| A/Professor Kon Kozak | 1/ 64 Arnisdale Rd | |
| Add Fitness | ||
| Ammerer Michelle Dr | 3/ 64 Armisdale Rd | |
| Andrew Ziepe Dr | Next To Mcdonalds Drive Thru 14 Burragah Way |
Venues and Restaurants (23)
| Headline | Place | Datetime |
|---|---|---|
| 2 Spice Guru Authentic Indian Restaurant | Shop 2 Glengarry Shopping Centre | |
| Carine Glades Tavern | 493 Beach Rd | |
| Crust Gourmet Pizza Bar | Shop 2, Carine Central, 8 Davallia Rd | |
| EAT | Duncraig Shopng Cntr Shop 11 50 Marri Rd | |
| EAT Cafe | Shop 11/50 Marri Rd |
Community Groups (9)
| Headline | Place | Datetime |
|---|---|---|
| Amana Living | 27 Beddi Rd | |
| Glengarry Private Hospital | 53 Arnisdale Rd | |
| Glengarry Village | 49 Arnisdale Rd | |
Education (18)
| Headline | Place | Datetime |
|---|---|---|
| Cheer Up North Cheerleading | ||
| Duncraig Early Learning Centre | 43 Beddi Rd | |
| Duncraig Secondary Education Support Centre | 43 Gilbert Rd | |
| Eleanor Mary Rooney | 4 Argyll Pl | |
| German Language Classes WA | 83 Bernedale Way |
Businesses (21)
| Name | Address |
|---|---|
| ROOFTEC | 6 Manuka Pl, Duncraig WA 6023, Australia |
| Indian Ocean Landscapes | 27 Maybud Rd, Duncraig WA 6023, Australia |
| Nudges Gardening and Home Maintenance | 6B Gidgee Pl, Duncraig WA 6023, Australia |
| Christine's Curtains | 20 Kalyba Pl, Duncraig WA 6023, Australia |
| Majestic Tiling Services | 1 Rica Cl, Duncraig WA 6023, Australia |
Recreational Facilities (4)
| Name | Address |
|---|---|
| VIP Entertainment | 1 Oban Ct, Duncraig WA 6023, Australia |
| DoubleGee Entertainment | |
| Pilates with Hart - Duncraig & Caversham | 40 Warwick Rd, Duncraig WA 6023, Australia |
| Wind Dancer Yacht Charters |
Tourism (4)
| Name | Address |
|---|---|
| Carine Travel Bug | 4/473 Beach Road, Carine Quarter, Duncraig WA 6023, Australia |
| Tour de Force Travel | Carine Quarter, 4/473 Beach Road, Duncraig WA 6023, Australia |
| Tour De Force Travel | Carine Quarter, 4/473 Beach Road |
| Carine Travel Bug / n.zed holidays | Unit 1 Carine Central Rear Of Carine Glades Shopping Centre 8 Davallia Road |
Loading entities ..