.png)
Profiles
Nearby Suburbs
What Kind of People Live in Glen Innes NSW 2370?
Diversity Levels in Glen Innes
The proportion of the population who are not 3rd+ generation Anglo-Australians
Sources: ABS, TORREN and Microburbs, 2006 - 2023
Sources: ABS, TORREN and Microburbs, 2006 - 2023
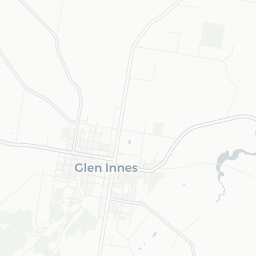
Glen Innes
17.5%
Glen Innes
17.5%
New England and North West
22.1%
New England and North West
22.1%
| Field | Value | VS New England and North West | Trend | |
|---|---|---|---|---|
| 49 | Top 32% |
|
||
| Premium | Premium | Premium | ||
| Premium | Premium | Premium | ||
| 8.0% | Top 11% |
|
||
| 9.6% | Bottom 31% |
|
Quality of Life in Glen Innes

The proportion of residents who enjoy a healthy, satisfying life.
Sources: ABS, AIHW, DSS, GEOSPATIAL, GOOGLE, TORREN and Microburbs, 2006 - 2045
Sources: ABS, AIHW, DSS, GEOSPATIAL, GOOGLE, TORREN and Microburbs, 2006 - 2045
Glen Innes
69.0%
Glen Innes
69.0%
New England and North West
71.8%
New England and North West
71.8%
| Field | Value | VS New England and North West | Trend | |
|---|---|---|---|---|
| 1 | Bottom 31% | Data for Jun 2023 | ||
| 80 | Top 25% | Data for Dec 2016 | ||
| 73.0 | Bottom 43% | Data for May 2023 | ||
| 37.0 | Top 46% | Data for May 2023 | ||
| 99.7% | Top 1% | Data for May 2023 |
Conservatism in Glen Innes
The proportion of the population who hold traditional values.
Sources: ABS, AEC and Microburbs, 2006 - 2023
Sources: ABS, AEC and Microburbs, 2006 - 2023
| Field | Value | VS New England and North West | Trend | |
|---|---|---|---|---|
| 66.0% | Top 28% | Data for May 2023 | ||
| 81.3% | Bottom 43% |
|
||
| 64.4% | Top 21% | Data for Dec 2022 |
Convenience Score in Glen Innes

The higher the score, the faster the travel time to regular amenities like work and shopping and the easier it is to access them without private cars.
Sources: ABS, GEOSPATIAL, TORREN and Microburbs, 2006 - 2023
Sources: ABS, GEOSPATIAL, TORREN and Microburbs, 2006 - 2023
Glen Innes
67.0
Glen Innes
67.0
New England and North West
67.2
New England and North West
67.2
| Field | Value | VS New England and North West | Trend | |
|---|---|---|---|---|
| 0.0% | Bottom 35% | Data for Dec 2021 | ||
| 1.7 | Bottom 28% |
|
||
| 0.5% | Top 14% |
|
||
| 64 km | Top 30% | Data for Mar 2023 | ||
| 6.7% | Top 22% |
|
Hip Score in Glen Innes
The higher the score, the more fashionable and lively an area is: a trendy, progressive population with easy access to nightlife and culture.
Sources: ABS, AEC, GOOGLE and Microburbs, 2006 - 2023
Sources: ABS, AEC, GOOGLE and Microburbs, 2006 - 2023
Glen Innes
61.0
Glen Innes
61.0
New England and North West
59.9
New England and North West
59.9
| Field | Value | VS New England and North West | Trend | |
|---|---|---|---|---|
| 53% | Bottom 15% | Data for Nov 2017 | ||
| 0 | Bottom 27% | Data for Aug 2023 | ||
| 11.0 | Top 8% | Data for May 2023 | ||
| 34.1% | Bottom 24% |
|
||
| 1.3% | Top 46% |
|
||
| 52.0% | Top 20% |
|
||
| 22.4% | Bottom 35% | Data for Dec 2022 | ||
| 0.4% | Top 8% |
|
Community Score in Glen Innes
The higher the score, the more time residents spend contributing the local community and the more connected residents are to their community.
Sources: ABS, GOOGLE and Microburbs, 2006 - 2023
Sources: ABS, GOOGLE and Microburbs, 2006 - 2023
Glen Innes
88.0
Glen Innes
88.0
New England and North West
87.1
New England and North West
87.1
| Field | Value | VS New England and North West | Trend | |
|---|---|---|---|---|
| 13.0 | Top 1% | Data for May 2023 | ||
| 93.7% | Bottom 24% | Data for Dec 2014 | ||
| 37.9% | Top 42% |
|
Family Score in Glen Innes
The higher the score, the more suitable the suburb is to families with children: good schools, safe, plentiful families, child-friendly amenities like playgrounds
Sources: ABS, DSS, TORREN and Microburbs, 2006 - 2023
Sources: ABS, DSS, TORREN and Microburbs, 2006 - 2023
Glen Innes
68.0
Glen Innes
68.0
New England and North West
66.8
New England and North West
66.8
| Field | Value | VS New England and North West | Trend | |
|---|---|---|---|---|
| 38 | Bottom 12% | Data for Dec 2022 | ||
| 70 | Bottom 34% | Data for Dec 2022 | ||
| 107 | Bottom 42% | 0 to Dec 2020 | ||
| 60.2% | Bottom 24% |
|
||
| 5.5% | Top 27% |
|
||
| Premium | Premium | Premium |
Health Services (32)
| Headline | Place | Datetime |
|---|---|---|
| Amcal Pharmacy Glen Innes - Graydons | 230 Grey St | |
| Amplifon Glen Innes | Healthwise | |
| Andrews Michael G | 170 Bourke St | |
| Body Fusion Bowen Therapy & Massage | 271 Grey St | |
| Casey Christina | 3 Elizabeth St |
Education (15)
| Headline | Place | Datetime |
|---|---|---|
| Aussie Kindies Glen Innes | 20 Oliver St | |
| GLEN INNES ST JOSEPH'S SCHOOL | 161A Church St | |
Tourism (4)
| Headline | Place | Datetime |
|---|---|---|
| Australian Celtic Festival | ||
| Super Strawberry The | Armidale Rd | |
Venues and Restaurants (23)
| Headline | Place | Datetime |
|---|---|---|
| Cuisine Cafe | 305 Grey St | |
| Hi-Way Diner | 200 Church St | |
| Taj Curry House Indian Restaurant | 281 Grey St | |
| The Singing Chef Italian Restaurant | 67 Church St | |
| The Tasting Room | 296 Grey St |
Community Groups (26)
| Headline | Place | Datetime |
|---|---|---|
| Glen Innes & District Services Club | Cnr Lang and Grey Sts | |
| Glen Innes Corps | Bourke St | |
| Glen Innes Correctional Centre | 11661 Gwydir Hwy | |
| Glen Innes Local Aboriginal Land Council | 181 Lang St | |
| Glen Innes Men's Shed | Torrington St |
Businesses (27)
| Headline | Place | Datetime |
|---|---|---|
| Redrose Framing | 198 Bourke St | |
Recreational Facilities (12)
| Name | Address |
|---|---|
| Arts North West | 16 East Ave, Glen Innes NSW 2370, Australia |
| Stocks Camping & Fishing | 180 Bourke St, Glen Innes NSW 2370, Australia |
| Glen Innes Bowling Club | Macquarie St |
| Stocks Camping and Fishing | 180, Bourke St |
| Stocks Camping and Fishing | 180, Bourke St |
Loading entities ..