.png)
Profiles
Nearby Suburbs
What Kind of People Live in Moura QLD 4718?
Diversity Levels in Moura
The proportion of the population who are not 3rd+ generation Anglo-Australians
Sources: ABS, TORREN and Microburbs, 2006 - 2023
Sources: ABS, TORREN and Microburbs, 2006 - 2023
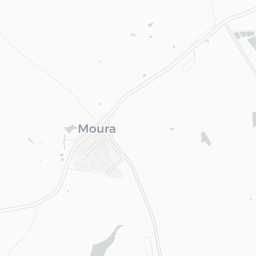
Moura
16.5%
Moura
16.5%
Central Queensland
20.7%
Central Queensland
20.7%
| Field | Value | VS Central Queensland | Trend | |
|---|---|---|---|---|
| 34 | Bottom 13% |
|
||
| Premium | Premium | Premium | ||
| Premium | Premium | Premium | ||
| 6.5% | Top 15% |
|
||
| 9.6% | Bottom 31% |
|
Quality of Life in Moura

The proportion of residents who enjoy a healthy, satisfying life.
Sources: ABS, AIHW, DSS, GEOSPATIAL, GOOGLE, TORREN and Microburbs, 2006 - 2045
Sources: ABS, AIHW, DSS, GEOSPATIAL, GOOGLE, TORREN and Microburbs, 2006 - 2045
Moura
73.0%
Moura
73.0%
Central Queensland
75.1%
Central Queensland
75.1%
| Field | Value | VS Central Queensland | Trend | |
|---|---|---|---|---|
| 0 | Bottom 13% | Data for Jun 2023 | ||
| 81 | Top 1% | Data for Dec 2016 | ||
| 74.0 | Top 47% | Data for May 2023 | ||
| 40.0 | Top 30% | Data for May 2023 | ||
| 98.1% | Top 17% | Data for May 2023 |
Conservatism in Moura
The proportion of the population who hold traditional values.
Sources: ABS, AEC and Microburbs, 2006 - 2023
Sources: ABS, AEC and Microburbs, 2006 - 2023
| Field | Value | VS Central Queensland | Trend | |
|---|---|---|---|---|
| 54.0% | Bottom 45% | Data for May 2023 | ||
| 83.8% | Bottom 49% |
|
||
| 60.3% | Top 30% | Data for Dec 2022 |
Convenience Score in Moura

The higher the score, the faster the travel time to regular amenities like work and shopping and the easier it is to access them without private cars.
Sources: ABS, GEOSPATIAL, TORREN and Microburbs, 2006 - 2023
Sources: ABS, GEOSPATIAL, TORREN and Microburbs, 2006 - 2023
Moura
69.0
Moura
69.0
Central Queensland
71.5
Central Queensland
71.5
| Field | Value | VS Central Queensland | Trend | |
|---|---|---|---|---|
| 0.3% | Top 25% |
|
||
| 1.9 | Bottom 38% |
|
||
| 0.7% | Top 11% |
|
||
| 130 km | Top 12% | Data for Mar 2023 | ||
| 5.5% | Top 26% |
|
Hip Score in Moura
The higher the score, the more fashionable and lively an area is: a trendy, progressive population with easy access to nightlife and culture.
Sources: ABS, AEC, GOOGLE and Microburbs, 2006 - 2023
Sources: ABS, AEC, GOOGLE and Microburbs, 2006 - 2023
Moura
60.0
Moura
60.0
Central Queensland
59.7
Central Queensland
59.7
| Field | Value | VS Central Queensland | Trend | |
|---|---|---|---|---|
| 52% | Bottom 13% | Data for Nov 2017 | ||
| 0 | Bottom 27% | Data for Aug 2023 | ||
| 0.0 | Bottom 43% | Data for May 2023 | ||
| 46.2% | Top 46% |
|
||
| 0.8% | Bottom 47% |
|
||
| 48.0% | Top 42% |
|
||
| 31.2% | Top 45% | Data for Dec 2022 | ||
| 0.1% | Top 17% |
|
Community Score in Moura
The higher the score, the more time residents spend contributing the local community and the more connected residents are to their community.
Sources: ABS, GOOGLE, TORREN and Microburbs, 2006 - 2023
Sources: ABS, GOOGLE, TORREN and Microburbs, 2006 - 2023
Moura
86.0
Moura
86.0
Central Queensland
86.3
Central Queensland
86.3
| Field | Value | VS Central Queensland | Trend | |
|---|---|---|---|---|
| 0.0 | Bottom 31% | Data for May 2023 | ||
| 93.4% | Bottom 17% | Data for Dec 2014 | ||
| 28.2% | Bottom 36% |
|
Family Score in Moura
The higher the score, the more suitable the suburb is to families with children: good schools, safe, plentiful families, child-friendly amenities like playgrounds
Sources: ABS, DSS, TORREN and Microburbs, 2006 - 2023
Sources: ABS, DSS, TORREN and Microburbs, 2006 - 2023
Moura
63.0
Moura
63.0
Central Queensland
68.3
Central Queensland
68.3
| Field | Value | VS Central Queensland | Trend | |
|---|---|---|---|---|
| 50 | Bottom 43% | Data for Dec 2022 | ||
| 49 | Bottom 24% | Data for Dec 2022 | ||
| 187 | Top 48% |
|
||
| 66.3% | Bottom 35% |
|
||
| 7.4% | Top 15% |
|
||
| Premium | Premium | Premium |
Venues and Restaurants (6)
| Headline | Place | Datetime |
|---|---|---|
| Country Atmosphere Cafe | 29 Gillespie St | |
| Dawson Highway Cafe & Indian Cuisine | 3/39 Young St | |
| Moura Tavern | 8 Bell St | |
Health Services (2)
| Headline | Place | Datetime |
|---|---|---|
| Moura Pharmacy | Marshall St | |
| Moura Dawson Medical Practice | 1 Minogue St |
Businesses (5)
| Name | Address |
|---|---|
| Sonder Hair & Beauty | 25 Gillespie St, Moura QLD 4718, Australia |
| Moura House Of Beauty | 33 Gillespie St, Moura QLD 4718, Australia |
| Elders Moura | |
| Moura Pool | 21, Davey St |
| Elders | Dawson Parade |
Education (1)
| Name | Address |
|---|---|
| C&K Moura Community Kindergarten | 5 Scenic St, Moura QLD 4718, Australia |
Recreational Facilities (1)
| Name | Address |
|---|---|
| Moura Memorial Pool | 21 Davey St, Moura QLD 4718, Australia |
Community Groups (1)
| Name | Address |
|---|---|
| Moura RSL Service & Citizen Club | Young St & Marshall St, Moura QLD 4718, Australia |
Loading entities ..