.png)
Profiles
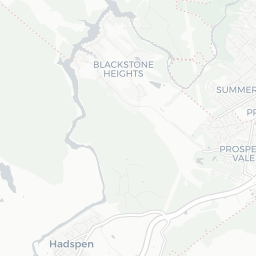
Nearby Suburbs
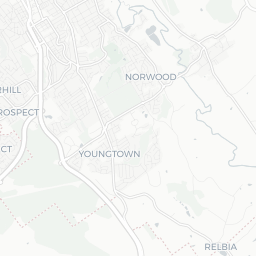
What Kind of People Live in Norwood (Tas.) TAS 7250?
Diversity Levels in Norwood (Tas.)
The proportion of the population who are not 3rd+ generation Anglo-Australians
Sources: ABS, TORREN and Microburbs, 2006 - 2023
Sources: ABS, TORREN and Microburbs, 2006 - 2023
Norwood (Tas.)
17.6%
Norwood (Tas.)
17.6%
Launceston and North East Tas
20.6%
Launceston and North East Tas
20.6%
| Field | Value | VS Launceston and North East Tas | Trend | |
|---|---|---|---|---|
| 48 | Top 36% |
|
||
| Premium | Premium | Premium | ||
| Premium | Premium | Premium | ||
| 2.6% | Top 36% |
|
||
| 14.6% | Bottom 48% |
|
Quality of Life in Norwood (Tas.)

The proportion of residents who enjoy a healthy, satisfying life.
Sources: ABS, AIHW, DSS, GEOSPATIAL, GOOGLE, TORREN and Microburbs, 2006 - 2045
Sources: ABS, AIHW, DSS, GEOSPATIAL, GOOGLE, TORREN and Microburbs, 2006 - 2045
Norwood (Tas.)
75.0%
Norwood (Tas.)
75.0%
Launceston and North East Tas
70.6%
Launceston and North East Tas
70.6%
| Field | Value | VS Launceston and North East Tas | Trend | |
|---|---|---|---|---|
| 5 | Top 42% | Data for Jun 2023 | ||
| 79 | Top 34% | Data for Dec 2016 | ||
| 77.0 | Top 24% | Data for May 2023 | ||
| 37.0 | Top 46% | Data for May 2023 | ||
| 99.2% | Top 7% | Data for May 2023 |
Conservatism in Norwood (Tas.)
The proportion of the population who hold traditional values.
Sources: ABS, AEC and Microburbs, 2006 - 2023
Sources: ABS, AEC and Microburbs, 2006 - 2023
Norwood (Tas.)
32.5%
Norwood (Tas.)
32.5%
Launceston and North East Tas
31.4%
Launceston and North East Tas
31.4%
| Field | Value | VS Launceston and North East Tas | Trend | |
|---|---|---|---|---|
| 55.0% | Bottom 47% | Data for May 2023 | ||
| 82.8% | Bottom 46% |
|
||
| 49.6% | Bottom 46% | Data for Dec 2022 |
Convenience Score in Norwood (Tas.)

The higher the score, the faster the travel time to regular amenities like work and shopping and the easier it is to access them without private cars.
Sources: ABS, GEOSPATIAL, TORREN and Microburbs, 2006 - 2023
Sources: ABS, GEOSPATIAL, TORREN and Microburbs, 2006 - 2023
Norwood (Tas.)
75.0
Norwood (Tas.)
75.0
Launceston and North East Tas
69.3
Launceston and North East Tas
69.3
| Field | Value | VS Launceston and North East Tas | Trend | |
|---|---|---|---|---|
| 0.5% | Top 21% |
|
||
| 1.8 | Bottom 36% | 0 to Jan 2021 | ||
| 0.8% | Top 10% |
|
||
| 4 km | Bottom 5% | Data for Mar 2023 | ||
| 1.7% | Top 45% |
|
Hip Score in Norwood (Tas.)
The higher the score, the more fashionable and lively an area is: a trendy, progressive population with easy access to nightlife and culture.
Sources: ABS, AEC, GOOGLE and Microburbs, 2006 - 2023
Sources: ABS, AEC, GOOGLE and Microburbs, 2006 - 2023
Norwood (Tas.)
61.0
Norwood (Tas.)
61.0
Launceston and North East Tas
60.7
Launceston and North East Tas
60.7
| Field | Value | VS Launceston and North East Tas | Trend | |
|---|---|---|---|---|
| 62% | Bottom 49% | Data for Nov 2017 | ||
| 44.6% | Bottom 48% |
|
||
| 4.0% | Top 21% |
|
||
| 48.0% | Top 42% |
|
||
| 34.6% | Top 38% | Data for Dec 2022 | ||
| 0.1% | Top 18% |
|
Community Score in Norwood (Tas.)
The higher the score, the more time residents spend contributing the local community and the more connected residents are to their community.
Sources: ABS, GOOGLE and Microburbs, 2006 - 2023
Sources: ABS, GOOGLE and Microburbs, 2006 - 2023
Norwood (Tas.)
93.0
Norwood (Tas.)
93.0
Launceston and North East Tas
85.9
Launceston and North East Tas
85.9
| Field | Value | VS Launceston and North East Tas | Trend | |
|---|---|---|---|---|
| 95.4% | Top 31% | Data for Dec 2014 | ||
| 39.6% | Top 39% |
|
Family Score in Norwood (Tas.)
The higher the score, the more suitable the suburb is to families with children: good schools, safe, plentiful families, child-friendly amenities like playgrounds
Sources: ABS, DSS, TORREN and Microburbs, 2006 - 2023
Sources: ABS, DSS, TORREN and Microburbs, 2006 - 2023
Norwood (Tas.)
81.0
Norwood (Tas.)
81.0
Launceston and North East Tas
70.4
Launceston and North East Tas
70.4
| Field | Value | VS Launceston and North East Tas | Trend | |
|---|---|---|---|---|
| 997 | Top 18% |
|
||
| 67.9% | Bottom 39% |
|
||
| 3.4% | Bottom 48% |
|
||
| Premium | Premium | Premium |
Businesses (6)
| Name | Address |
|---|---|
| Solution Planners | 5 Bertland Ct, Norwood TAS 7250, Australia |
| Brett Stephens | 114, Quarantine Rd |
| Brett Stephens | 114, Quarantine Rd |
| Concept Rentals | 10, Gretna Gr |
| Girls Go Green |
Education (3)
| Name | Address |
|---|---|
| Norwood Primary School | 103 Norwood Ave, Norwood TAS 7250, Australia |
| Lady Gowrie Tasmania Norwood | 103 Norwood Ave, Norwood TAS 7250, Australia |
| Queechy High School | 161 Penquite Rd, Norwood TAS 7250, Australia |
Recreational Facilities (2)
| Name | Address |
|---|---|
| Family Black Belt Academy | 9 Armidale St, Norwood TAS 7250, Australia |
| Norwood Jiu Jitsu |
Health Services (5)
| Name | Address |
|---|---|
| Judd Miles | 212 Penquite Rd, Norwood TAS 7250, Australia |
| Masonic Care Tasmania | 185, Penquite Rd |
| Masonic Care Tasmania | 185, Penquite Rd |
| Harvey Griggs | 248, Penquite Rd |
| Walker Charles | 212, Penquite Rd |
Venues and Restaurants (1)
| Name | Address |
|---|---|
| Stonesthrow Launceston | 55, Sandown Rd |
Loading entities ..