.png)
Profiles
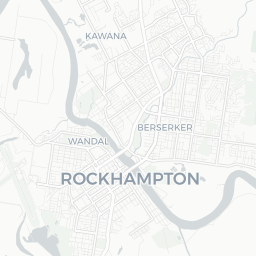
Nearby Suburbs
What Kind of People Live in Rockhampton City QLD 4700?
Diversity Levels in Rockhampton City
The proportion of the population who are not 3rd+ generation Anglo-Australians
Sources: ABS, TORREN and Microburbs, 2006 - 2023
Sources: ABS, TORREN and Microburbs, 2006 - 2023
Rockhampton City
26.4%
Rockhampton City
26.4%
Central Queensland
20.7%
Central Queensland
20.7%
| Field | Value | VS Central Queensland | Trend | |
|---|---|---|---|---|
| 42 | Bottom 39% |
|
||
| Premium | Premium | Premium | ||
| Premium | Premium | Premium | ||
| 8.9% | Top 9% |
|
||
| 17.1% | Top 44% |
|
Quality of Life in Rockhampton City

The proportion of residents who enjoy a healthy, satisfying life.
Sources: ABS, AIHW, DSS, GEOSPATIAL, GOOGLE, TORREN and Microburbs, 2006 - 2045
Sources: ABS, AIHW, DSS, GEOSPATIAL, GOOGLE, TORREN and Microburbs, 2006 - 2045
Rockhampton City
73.0%
Rockhampton City
73.0%
Central Queensland
75.1%
Central Queensland
75.1%
| Field | Value | VS Central Queensland | Trend | |
|---|---|---|---|---|
| 3 | Bottom 44% | Data for Jun 2023 | ||
| 78 | Bottom 35% | Data for Dec 2016 | ||
| 77.0 | Top 24% | Data for May 2023 | ||
| 22.0 | Bottom 2% | Data for May 2023 | ||
| 98.6% | Top 14% | Data for May 2023 |
Conservatism in Rockhampton City
The proportion of the population who hold traditional values.
Sources: ABS, AEC and Microburbs, 2006 - 2023
Sources: ABS, AEC and Microburbs, 2006 - 2023
| Field | Value | VS Central Queensland | Trend | |
|---|---|---|---|---|
| 55.0% | Bottom 47% | Data for May 2023 | ||
| 82.6% | Bottom 46% |
|
||
| 49.7% | Bottom 46% | Data for Dec 2022 |
Convenience Score in Rockhampton City

The higher the score, the faster the travel time to regular amenities like work and shopping and the easier it is to access them without private cars.
Sources: ABS, GEOSPATIAL, TORREN and Microburbs, 2006 - 2023
Sources: ABS, GEOSPATIAL, TORREN and Microburbs, 2006 - 2023
Rockhampton City
82.0
Rockhampton City
82.0
Central Queensland
71.5
Central Queensland
71.5
| Field | Value | VS Central Queensland | Trend | |
|---|---|---|---|---|
| 0.2% | Top 26% |
|
||
| 1.4 | Bottom 19% |
|
||
| 1.9% | Top 3% |
|
||
| 0 km | Bottom 0% | Data for Mar 2023 | ||
| 14.0% | Top 10% |
|
Hip Score in Rockhampton City
The higher the score, the more fashionable and lively an area is: a trendy, progressive population with easy access to nightlife and culture.
Sources: ABS, AEC, GOOGLE and Microburbs, 2006 - 2023
Sources: ABS, AEC, GOOGLE and Microburbs, 2006 - 2023
Rockhampton City
63.0
Rockhampton City
63.0
Central Queensland
59.7
Central Queensland
59.7
| Field | Value | VS Central Queensland | Trend | |
|---|---|---|---|---|
| 54% | Bottom 19% | Data for Nov 2017 | ||
| 10 | Top 19% | Data for Aug 2023 | ||
| 22.0 | Top 2% | Data for May 2023 | ||
| 45.1% | Top 49% |
|
||
| 2.6% | Top 32% |
|
||
| 53.0% | Top 15% |
|
||
| 37.3% | Top 34% | Data for Dec 2022 | ||
| 0.5% | Top 6% |
|
Community Score in Rockhampton City
The higher the score, the more time residents spend contributing the local community and the more connected residents are to their community.
Sources: ABS, GOOGLE, TORREN and Microburbs, 2006 - 2023
Sources: ABS, GOOGLE, TORREN and Microburbs, 2006 - 2023
Rockhampton City
86.0
Rockhampton City
86.0
Central Queensland
86.3
Central Queensland
86.3
| Field | Value | VS Central Queensland | Trend | |
|---|---|---|---|---|
| 0.0 | Bottom 31% | Data for May 2023 | ||
| 93.3% | Bottom 15% | Data for Dec 2014 | ||
| 22.1% | Bottom 24% |
|
Family Score in Rockhampton City
The higher the score, the more suitable the suburb is to families with children: good schools, safe, plentiful families, child-friendly amenities like playgrounds
Sources: ABS, DSS, TORREN and Microburbs, 2006 - 2023
Sources: ABS, DSS, TORREN and Microburbs, 2006 - 2023
Rockhampton City
64.0
Rockhampton City
64.0
Central Queensland
68.3
Central Queensland
68.3
| Field | Value | VS Central Queensland | Trend | |
|---|---|---|---|---|
| 1110 | Top 15% | 0 to Dec 2020 | ||
| 51.0% | Bottom 15% |
|
||
| 5.3% | Top 29% |
|
||
| Premium | Premium | Premium |
Venues and Restaurants (26)
| Headline | Place | Datetime |
|---|---|---|
| Bartletts Club Tavern | 166 Kent St | |
| Coffee Society Rockhampton | 126 East St | |
| Empire Apartment Hotel | 5 East St | |
Community Groups (7)
| Headline | Place | Datetime |
|---|---|---|
| Capricornia Respite Care Association Inc | 2/ 74 Victoria Parade | |
Health Services (31)
| Headline | Place | Datetime |
|---|---|---|
| KINNECT | 118 Kent St | |
| Len Bauer's Massage & Rejuvenation Centre | 5/ 120A George St | |
| Mandy Dexter | ||
| Movement Improvement Physiotherapy | 85 Denham St | |
| South Rockhampton Discount Drug Store | Shop 8/ 111 George St |
Businesses (32)
| Name | Address |
|---|---|
| Kwik Kerb Rockhampton | 152 Campbell St, Rockhampton QLD 4700, Australia |
| Ken's Plumbing Plus | Cnr Gladstone & Murray Street,, South Rockhampton QLD 4700, Australia |
| Apollo Patios | 96 Bolsover St, Rockhampton QLD 4700, Australia |
| Parwoods Curtains & Blinds | 145 Thozet Rd, North Rockhampton QLD 4701, Australia |
| Bencraft Cabinet Makers & Joinery | 253 Denison St, Rockhampton QLD 4700, Australia |
Recreational Facilities (5)
| Name | Address |
|---|---|
| S&N Manufacturing | 113 Bolsover St, Rockhampton QLD 4700, Australia |
| Campco's Great Outdoors Centre | 121 William St, Rockhampton QLD 4700, Australia |
| Capricorn School of Dancing | Cherry Lane Arcade, East Street Mall, Rockhampton QLD 4700, Australia |
| Michael Robertson Studio of Dance and Musical Theatre | 158 Denison Ln, Rockhampton QLD 4700, Australia |
| Bee Fit Personal Training | 89 Denham St, Rockhampton QLD 4700, Australia |
Education (5)
| Name | Address |
|---|---|
| Advanced Heavy Vehicle Driver Training | 6 Albert St, Rockhampton QLD 4700, Australia |
| Smart City Vocational College | 160 Denison St, Rockhampton QLD 4700, Australia |
| City Child Care Centre | 189 Alma St, Rockhampton QLD 4700, Australia |
| Enhance Family Day Care Capricornia | Suite 3/6 Archer St, Rockhampton QLD 4700, Australia |
| Allsorts Developmental Services | 224 Quay St, Rockhampton QLD 4700, Australia |
Tourism (3)
| Name | Address |
|---|---|
| Helloworld Travel Rockhampton | 1/72 Bolsover St, Rockhampton QLD 4700, Australia |
| Travel Associates Rockhampton | Shop 1 Cnr Bolsover &, Denham St, Rockhampton QLD 4700, Australia |
| Wendy Mulry Travel | 128 Victoria Parade, Rockhampton QLD 4700, Australia |
Loading entities ..