.png)
Profiles
Nearby Suburbs
What Kind of People Live in Somerville (Vic.) VIC 3912?
Diversity Levels in Somerville (Vic.)
The proportion of the population who are not 3rd+ generation Anglo-Australians
Sources: ABS, TORREN and Microburbs, 2006 - 2023
Sources: ABS, TORREN and Microburbs, 2006 - 2023
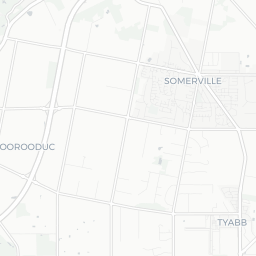
Somerville (Vic.)
21.5%
Somerville (Vic.)
21.5%
Mornington Peninsula
26.1%
Mornington Peninsula
26.1%
| Field | Value | VS Mornington Peninsula | Trend | |
|---|---|---|---|---|
| 40 | Bottom 32% |
|
||
| Premium | Premium | Premium | ||
| Premium | Premium | Premium | ||
| 1.0% | Bottom 49% |
|
||
| 21.2% | Top 33% |
|
Quality of Life in Somerville (Vic.)

The proportion of residents who enjoy a healthy, satisfying life.
Sources: ABS, AIHW, DSS, GEOSPATIAL, GOOGLE, TORREN and Microburbs, 2006 - 2045
Sources: ABS, AIHW, DSS, GEOSPATIAL, GOOGLE, TORREN and Microburbs, 2006 - 2045
Somerville (Vic.)
69.0%
Somerville (Vic.)
69.0%
Mornington Peninsula
69.8%
Mornington Peninsula
69.8%
| Field | Value | VS Mornington Peninsula | Trend | |
|---|---|---|---|---|
| 21 | Top 15% | Data for Jun 2023 | ||
| 79 | Bottom 47% | Data for Dec 2016 | ||
| 77.0 | Top 24% | Data for May 2023 | ||
| 31.0 | Bottom 20% | Data for May 2023 | ||
| 99.6% | Top 2% | Data for May 2023 | ||
| Premium | Premium | Premium |
Conservatism in Somerville (Vic.)
The proportion of the population who hold traditional values.
Sources: ABS, AEC and Microburbs, 2006 - 2023
Sources: ABS, AEC and Microburbs, 2006 - 2023
Somerville (Vic.)
34.6%
Somerville (Vic.)
34.6%
Mornington Peninsula
30.3%
Mornington Peninsula
30.3%
| Field | Value | VS Mornington Peninsula | Trend | |
|---|---|---|---|---|
| 43.0% | Bottom 18% | Data for May 2023 | ||
| 84.9% | Top 48% | Data for Jan 2021 | ||
| 49.6% | Bottom 46% | Data for Dec 2022 |
Convenience Score in Somerville (Vic.)

The higher the score, the faster the travel time to regular amenities like work and shopping and the easier it is to access them without private cars.
Sources: ABS, GEOSPATIAL, TORREN, GEOSERVER and Microburbs, 2006 - 2045
Sources: ABS, GEOSPATIAL, TORREN, GEOSERVER and Microburbs, 2006 - 2045
Somerville (Vic.)
73.0
Somerville (Vic.)
73.0
Mornington Peninsula
73.7
Mornington Peninsula
73.7
| Field | Value | VS Mornington Peninsula | Trend | |
|---|---|---|---|---|
| 0.2% | Top 26% |
|
||
| 2.1 | Top 43% | 0 to Jan 2021 | ||
| 0.2% | Top 20% |
|
||
| 3 km | Bottom 3% | Data for Mar 2023 | ||
| 1.5% | Top 47% |
|
Hip Score in Somerville (Vic.)
The higher the score, the more fashionable and lively an area is: a trendy, progressive population with easy access to nightlife and culture.
Sources: ABS, AEC, GOOGLE and Microburbs, 2006 - 2023
Sources: ABS, AEC, GOOGLE and Microburbs, 2006 - 2023
Somerville (Vic.)
62.0
Somerville (Vic.)
62.0
Mornington Peninsula
62.9
Mornington Peninsula
62.9
| Field | Value | VS Mornington Peninsula | Trend | |
|---|---|---|---|---|
| 70% | Top 17% | Data for Nov 2017 | ||
| 57.0% | Top 19% |
|
||
| 1.9% | Top 39% |
|
||
| 47.0% | Top 45% |
|
||
| 30.8% | Top 45% | Data for Dec 2022 | ||
| 0.1% | Top 18% |
|
Community Score in Somerville (Vic.)
The higher the score, the more time residents spend contributing the local community and the more connected residents are to their community.
Sources: ABS, GOOGLE, TORREN and Microburbs, 2006 - 2023
Sources: ABS, GOOGLE, TORREN and Microburbs, 2006 - 2023
Somerville (Vic.)
92.0
Somerville (Vic.)
92.0
Mornington Peninsula
87.3
Mornington Peninsula
87.3
| Field | Value | VS Mornington Peninsula | Trend | |
|---|---|---|---|---|
| 96.0% | Top 12% | Data for Dec 2014 | ||
| 23.2% | Bottom 26% |
|
Family Score in Somerville (Vic.)
The higher the score, the more suitable the suburb is to families with children: good schools, safe, plentiful families, child-friendly amenities like playgrounds
Sources: ABS, DSS, TORREN and Microburbs, 2006 - 2023
Sources: ABS, DSS, TORREN and Microburbs, 2006 - 2023
Somerville (Vic.)
78.0
Somerville (Vic.)
78.0
Mornington Peninsula
76.7
Mornington Peninsula
76.7
| Field | Value | VS Mornington Peninsula | Trend | |
|---|---|---|---|---|
| 62 | Top 19% | Data for Dec 2022 | ||
| 98 | Bottom 44% | Data for Dec 2022 | ||
| 2190 | Top 6% |
|
||
| 22.8 | Top 39% | Data for Dec 2016 | ||
| 74.8% | Top 44% |
|
||
| 4.0% | Top 43% |
|
||
| Premium | Premium | Premium |
Businesses (38)
| Name | Address |
|---|---|
| Caleb's Roofing | 31 Kumala Dr, Somerville VIC 3912, Australia |
| Unlimited Roofing Pty Ltd | 2/50 Guelph St, Somerville VIC 3912, Australia |
| B & D Roofing Pty Ltd | 32 Guelph St, Somerville VIC 3912, Australia |
| My Kitchen Transformations | Arduina St, Somerville VIC 3912, Australia |
| The Edge Garden Maintenance | 43 Simcock St, Somerville VIC 3912, Australia |
Recreational Facilities (11)
| Name | Address |
|---|---|
| Naturally Cool Pty Ltd. | 2/35 Simcock St, Somerville VIC 3912, Australia |
| Somerville Bowling Club | 259 Jones Rd, Somerville VIC 3912, Australia |
| Dance Lab | 2/36 Guelph St, Somerville VIC 3912, Australia |
| Dancesation School of Dance | |
| SMAC | 2/5 Simcock St, Somerville VIC 3912, Australia |
Health Services (20)
| Name | Address |
|---|---|
| Somerville Gardens Care Community - aged care | 22 Graf Rd, Somerville VIC 3912, Australia |
| Amity Care Services Pty Ltd | 10 Eramosa Rd E, Somerville VIC 3912, Australia |
| Provision Optometrists | 23 Eramosa Rd E, Somerville VIC 3912, Australia |
| Eye Style Optical | Shop 6 17 Eramosa Rd |
| Somerville Optical | 23, Eramosa Road East |
Venues and Restaurants (16)
| Name | Address |
|---|---|
| Coolart Country Smoke House | 8 Eramosa Rd W, Somerville VIC 3912, Australia |
| Yaringa Marina Restaurant | 1 Lumeah Rd, Somerville VIC 3912, Australia |
| McDonald's | |
| Ducky Brown Cafe | 10/17 Eramosa Rd W, Somerville VIC 3912, Australia |
| Chrissy's Kitchen | and, Grant Rd & Simcock St, Somerville VIC 3912, Australia |
Education (11)
| Name | Address |
|---|---|
| Somerville Primary School | Eramosa Rd E, Somerville VIC 3912, Australia |
| Somerville Rise Primary School | 34 Blacks Camp Rd, Somerville VIC 3912, Australia |
| Saint Brendan's Primary School | 19 Austin Rd, Somerville VIC 3912, Australia |
| Peninsula ART SPACE | 50 Guelph St, Somerville VIC 3912, Australia |
| Somerville School of Music | 45 Grant Rd, Somerville VIC 3912, Australia |
Community Groups (3)
| Name | Address |
|---|---|
| St. John's Retirement Village | 45 Park Ln, Somerville VIC 3912, Australia |
| St Andrew's Anglican Church Somerville | 2 Eramosa Rd W, Somerville VIC 3912, Australia |
| Presbyterian Church | 239 Jones Rd, Somerville VIC 3912, Australia |
Tourism (1)
| Name | Address |
|---|---|
| Somerville Travel & Cruise | Shop 22, 17 Eramosa Road West |
Loading entities ..