.png)
Profiles
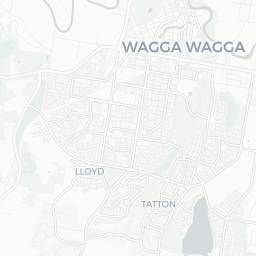
Nearby Suburbs
What Kind of People Live in Springvale (NSW) NSW 2650?
Diversity Levels in Springvale (NSW)
The proportion of the population who are not 3rd+ generation Anglo-Australians
Sources: ABS, TORREN and Microburbs, 2006 - 2023
Sources: ABS, TORREN and Microburbs, 2006 - 2023
Springvale (NSW)
11.5%
Springvale (NSW)
11.5%
Riverina
22.5%
Riverina
22.5%
| Field | Value | VS Riverina | Trend | |
|---|---|---|---|---|
| 41 | Bottom 35% |
|
||
| Premium | Premium | Premium | ||
| Premium | Premium | Premium | ||
| 2.5% | Top 36% |
|
||
| 8.2% | Bottom 27% |
|
Quality of Life in Springvale (NSW)

The proportion of residents who enjoy a healthy, satisfying life.
Sources: ABS, AIHW, DSS, GEOSPATIAL, GOOGLE, TORREN and Microburbs, 2006 - 2045
Sources: ABS, AIHW, DSS, GEOSPATIAL, GOOGLE, TORREN and Microburbs, 2006 - 2045
Springvale (NSW)
77.0%
Springvale (NSW)
77.0%
Riverina
74.5%
Riverina
74.5%
| Field | Value | VS Riverina | Trend | |
|---|---|---|---|---|
| 80 | Top 27% | Data for Dec 2016 | ||
| 43.0 | Top 19% | Data for May 2023 | ||
| 97.6% | Top 19% | Data for May 2023 |
Conservatism in Springvale (NSW)
The proportion of the population who hold traditional values.
Sources: ABS, AEC and Microburbs, 2006 - 2023
Sources: ABS, AEC and Microburbs, 2006 - 2023
Springvale (NSW)
-99900.0%
Springvale (NSW)
-99900.0%
Riverina
48.3%
Riverina
48.3%
| Field | Value | VS Riverina | Trend | |
|---|---|---|---|---|
| 80.0% | Top 12% | Data for May 2023 | ||
| 89.9% | Top 35% |
|
||
| 57.8% | Top 34% | Data for Dec 2022 |
Convenience Score in Springvale (NSW)

The higher the score, the faster the travel time to regular amenities like work and shopping and the easier it is to access them without private cars.
Sources: ABS, GEOSPATIAL, TORREN and Microburbs, 2006 - 2023
Sources: ABS, GEOSPATIAL, TORREN and Microburbs, 2006 - 2023
| Field | Value | VS Riverina | Trend | |
|---|---|---|---|---|
| 0.0% | Bottom 35% |
|
||
| 3.0 | Top 9% |
|
||
| 0.3% | Top 18% |
|
||
| 8 km | Bottom 12% | Data for Mar 2023 | ||
| 1.0% | Bottom 45% |
|
Hip Score in Springvale (NSW)
The higher the score, the more fashionable and lively an area is: a trendy, progressive population with easy access to nightlife and culture.
Sources: ABS, AEC, GOOGLE and Microburbs, 2006 - 2023
Sources: ABS, AEC, GOOGLE and Microburbs, 2006 - 2023
| Field | Value | VS Riverina | Trend | |
|---|---|---|---|---|
| 55% | Bottom 23% | Data for Nov 2017 | ||
| 20.1% | Bottom 8% |
|
||
| 4.1% | Top 21% |
|
||
| 27.0% | Bottom 9% |
|
||
| 28.2% | Bottom 49% | Data for Dec 2022 | ||
| 0.0% | Bottom 37% | Data for Jan 2021 |
Community Score in Springvale (NSW)
The higher the score, the more time residents spend contributing the local community and the more connected residents are to their community.
Sources: ABS, GOOGLE and Microburbs, 2006 - 2023
Sources: ABS, GOOGLE and Microburbs, 2006 - 2023
| Field | Value | VS Riverina | Trend | |
|---|---|---|---|---|
| 94.0% | Bottom 35% | Data for Dec 2014 | ||
| 45.2% | Top 29% |
|
Family Score in Springvale (NSW)
The higher the score, the more suitable the suburb is to families with children: good schools, safe, plentiful families, child-friendly amenities like playgrounds
Sources: ABS, DSS, TORREN and Microburbs, 2006 - 2023
Sources: ABS, DSS, TORREN and Microburbs, 2006 - 2023
| Field | Value | VS Riverina | Trend | |
|---|---|---|---|---|
| 93.9% | Top 9% |
|
||
| 2.9% | Bottom 43% |
|
||
| Premium | Premium | Premium |
Recreational Facilities (4)
| Name | Address |
|---|---|
| Dalmac Vending | |
| Corey Tozer Construction | 49, Featherwood Dr |
| Dalmac Vending | |
| Karma for Kids with Sam | 2, Hickory Pl |
Businesses (9)
| Name | Address |
|---|---|
| Natural Edge Milling | 2 Glenoak Dr, Springvale NSW 2650, Australia |
| Rava's Carpet Cleaning | 3, Springvale Dr |
| Rava's Carpet Cleaning | 3, Springvale Dr |
| Triple 888 Property Maintenance | 11, Mallee Rd |
| Rava's Carpet Cleaning | 3, Springvale Dr |
Loading entities ..