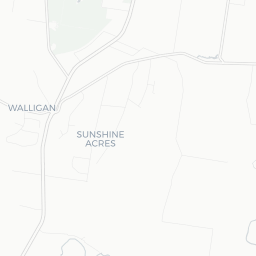
.png)
Profiles
Nearby Suburbs
What Kind of People Live in Sunshine Acres QLD 4655?
Diversity Levels in Sunshine Acres
The proportion of the population who are not 3rd+ generation Anglo-Australians
Sources: ABS, TORREN and Microburbs, 2006 - 2023
Sources: ABS, TORREN and Microburbs, 2006 - 2023
Sunshine Acres
21.2%
Sunshine Acres
21.2%
Wide Bay
20.0%
Wide Bay
20.0%
| Field | Value | VS Wide Bay | Trend | |
|---|---|---|---|---|
| 44 | Bottom 48% |
|
||
| Premium | Premium | Premium | ||
| Premium | Premium | Premium | ||
| 6.2% | Top 16% |
|
||
| 14.9% | Bottom 49% |
|
Quality of Life in Sunshine Acres

The proportion of residents who enjoy a healthy, satisfying life.
Sources: ABS, AIHW, DSS, GEOSPATIAL, GOOGLE, TORREN and Microburbs, 2006 - 2045
Sources: ABS, AIHW, DSS, GEOSPATIAL, GOOGLE, TORREN and Microburbs, 2006 - 2045
Sunshine Acres
74.0%
Sunshine Acres
74.0%
Wide Bay
72.8%
Wide Bay
72.8%
| Field | Value | VS Wide Bay | Trend | |
|---|---|---|---|---|
| 2 | Bottom 41% | Data for Jun 2023 | ||
| 80 | Top 26% | Data for Dec 2016 | ||
| 74.0 | Top 47% | Data for May 2023 | ||
| 28.0 | Bottom 10% | Data for May 2023 | ||
| 97.3% | Top 21% | Data for May 2023 |
Conservatism in Sunshine Acres
The proportion of the population who hold traditional values.
Sources: ABS and Microburbs, 2006 - 2023
Sources: ABS and Microburbs, 2006 - 2023
| Field | Value | VS Wide Bay | Trend | |
|---|---|---|---|---|
| 54.0% | Bottom 45% | Data for May 2023 | ||
| 76.2% | Bottom 34% |
|
Convenience Score in Sunshine Acres

The higher the score, the faster the travel time to regular amenities like work and shopping and the easier it is to access them without private cars.
Sources: ABS, GEOSPATIAL, TORREN and Microburbs, 2006 - 2023
Sources: ABS, GEOSPATIAL, TORREN and Microburbs, 2006 - 2023
Sunshine Acres
61.0
Sunshine Acres
61.0
Wide Bay
68.7
Wide Bay
68.7
| Field | Value | VS Wide Bay | Trend | |
|---|---|---|---|---|
| 0.3% | Top 25% |
|
||
| 2.8 | Top 13% |
|
||
| 0.0% | Bottom 38% | Data for Dec 2021 | ||
| 12 km | Bottom 19% | Data for Mar 2023 | ||
| 2.5% | Top 39% |
|
Hip Score in Sunshine Acres
The higher the score, the more fashionable and lively an area is: a trendy, progressive population with easy access to nightlife and culture.
Sources: ABS, AEC, GOOGLE and Microburbs, 2006 - 2023
Sources: ABS, AEC, GOOGLE and Microburbs, 2006 - 2023
Sunshine Acres
58.0
Sunshine Acres
58.0
Wide Bay
61.1
Wide Bay
61.1
| Field | Value | VS Wide Bay | Trend | |
|---|---|---|---|---|
| 51% | Bottom 12% | Data for Nov 2017 | ||
| 46.2% | Top 46% |
|
||
| 1.6% | Top 43% |
|
||
| 42.0% | Bottom 31% |
|
||
| 0.4% | Top 8% |
|
Community Score in Sunshine Acres
The higher the score, the more time residents spend contributing the local community and the more connected residents are to their community.
Sources: ABS, GOOGLE, TORREN and Microburbs, 2006 - 2023
Sources: ABS, GOOGLE, TORREN and Microburbs, 2006 - 2023
Sunshine Acres
91.0
Sunshine Acres
91.0
Wide Bay
87.4
Wide Bay
87.4
| Field | Value | VS Wide Bay | Trend | |
|---|---|---|---|---|
| 92.5% | Bottom 3% | Data for Dec 2014 | ||
| 19.7% | Bottom 20% |
|
Family Score in Sunshine Acres
The higher the score, the more suitable the suburb is to families with children: good schools, safe, plentiful families, child-friendly amenities like playgrounds
Sources: ABS, DSS, TORREN and Microburbs, 2006 - 2023
Sources: ABS, DSS, TORREN and Microburbs, 2006 - 2023
Sunshine Acres
71.0
Sunshine Acres
71.0
Wide Bay
68.3
Wide Bay
68.3
| Field | Value | VS Wide Bay | Trend | |
|---|---|---|---|---|
| 86.4% | Top 16% |
|
||
| 4.4% | Top 39% |
|
||
| Premium | Premium | Premium |
Businesses (4)
| Name | Address |
|---|---|
| Grant Cole Joinery - Kitchen Renovations Hervey Bay | 108 Karinya Cct, Sunshine Acres QLD 4655, Australia |
| Grant Cole Joinery | 108, Karinya Cct |
| Grant Cole Joinery | 108, Karinya Cct |
| Pat And Jenny McKillop | 33, Pindari Cres |
Recreational Facilities (2)
| Name | Address |
|---|---|
| 5 Star Canvas Fraser Coast | 27, Barranjoey Dr |
| 5 Star Canvas Fraser Coast | 27, Barranjoey Dr |
Loading entities ..