.png)
Profiles
Nearby Suburbs
What Kind of People Live in Tawonga VIC 3697?
Diversity Levels in Tawonga
The proportion of the population who are not 3rd+ generation Anglo-Australians
Sources: ABS, TORREN and Microburbs, 2006 - 2023
Sources: ABS, TORREN and Microburbs, 2006 - 2023
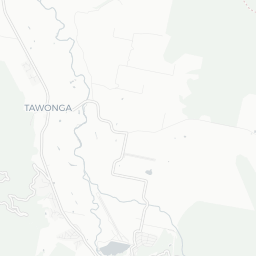
Tawonga
17.5%
Tawonga
17.5%
Hume
17.2%
Hume
17.2%
| Field | Value | VS Hume | Trend | |
|---|---|---|---|---|
| 52 | Top 22% |
|
||
| Premium | Premium | Premium | ||
| Premium | Premium | Premium | ||
| 0.5% | Bottom 43% |
|
||
| 19.7% | Top 36% |
|
Quality of Life in Tawonga

The proportion of residents who enjoy a healthy, satisfying life.
Sources: ABS, AIHW, DSS, GEOSPATIAL, GOOGLE, TORREN and Microburbs, 2006 - 2045
Sources: ABS, AIHW, DSS, GEOSPATIAL, GOOGLE, TORREN and Microburbs, 2006 - 2045
Tawonga
70.0%
Tawonga
70.0%
Hume
74.2%
Hume
74.2%
| Field | Value | VS Hume | Trend | |
|---|---|---|---|---|
| 1 | Bottom 29% | Data for Jun 2023 | ||
| 80 | Top 24% | Data for Dec 2016 | ||
| 78.0 | Top 18% | Data for May 2023 | ||
| 31.0 | Bottom 20% | Data for May 2023 | ||
| 93.4% | Top 30% | Data for May 2023 |
Conservatism in Tawonga
The proportion of the population who hold traditional values.
Sources: ABS, AEC and Microburbs, 2006 - 2023
Sources: ABS, AEC and Microburbs, 2006 - 2023
Tawonga
30.6%
Tawonga
30.6%
Hume
33.2%
Hume
33.2%
| Field | Value | VS Hume | Trend | |
|---|---|---|---|---|
| 40.0% | Bottom 13% | Data for May 2023 | ||
| 94.6% | Top 24% |
|
||
| 45.3% | Bottom 36% | Data for Dec 2022 |
Convenience Score in Tawonga

The higher the score, the faster the travel time to regular amenities like work and shopping and the easier it is to access them without private cars.
Sources: ABS, GEOSPATIAL, TORREN and Microburbs, 2006 - 2023
Sources: ABS, GEOSPATIAL, TORREN and Microburbs, 2006 - 2023
Tawonga
65.0
Tawonga
65.0
Hume
67.0
Hume
67.0
| Field | Value | VS Hume | Trend | |
|---|---|---|---|---|
| 0.0% | Bottom 35% |
|
||
| 2.3 | Top 36% |
|
||
| 0.0% | Bottom 38% | Data for Dec 2021 | ||
| 72 km | Top 27% | Data for Mar 2023 | ||
| 1.5% | Top 48% |
|
Hip Score in Tawonga
The higher the score, the more fashionable and lively an area is: a trendy, progressive population with easy access to nightlife and culture.
Sources: ABS, AEC, GOOGLE and Microburbs, 2006 - 2023
Sources: ABS, AEC, GOOGLE and Microburbs, 2006 - 2023
Tawonga
66.0
Tawonga
66.0
Hume
62.0
Hume
62.0
| Field | Value | VS Hume | Trend | |
|---|---|---|---|---|
| 63% | Top 44% | Data for Nov 2017 | ||
| 0 | Bottom 27% | Data for Aug 2023 | ||
| 0.0 | Bottom 43% | Data for May 2023 | ||
| 59.5% | Top 14% |
|
||
| 3.7% | Top 23% |
|
||
| 49.0% | Top 35% |
|
||
| 10.8% | Bottom 7% | Data for Dec 2022 | ||
| 0.0% | Bottom 37% | Data for Jan 2021 |
Community Score in Tawonga
The higher the score, the more time residents spend contributing the local community and the more connected residents are to their community.
Sources: ABS, GOOGLE, TORREN and Microburbs, 2006 - 2023
Sources: ABS, GOOGLE, TORREN and Microburbs, 2006 - 2023
Tawonga
94.0
Tawonga
94.0
Hume
88.2
Hume
88.2
| Field | Value | VS Hume | Trend | |
|---|---|---|---|---|
| 0.0 | Bottom 31% | Data for May 2023 | ||
| 96.0% | Top 11% | Data for Dec 2014 | ||
| 59.3% | Top 14% |
|
Family Score in Tawonga
The higher the score, the more suitable the suburb is to families with children: good schools, safe, plentiful families, child-friendly amenities like playgrounds
Sources: ABS, DSS, TORREN and Microburbs, 2006 - 2023
Sources: ABS, DSS, TORREN and Microburbs, 2006 - 2023
Tawonga
83.0
Tawonga
83.0
Hume
70.9
Hume
70.9
| Field | Value | VS Hume | Trend | |
|---|---|---|---|---|
| 144 | Bottom 46% |
|
||
| 24.9 | Top 29% | Data for Dec 2016 | ||
| 71.3% | Bottom 47% |
|
||
| 2.3% | Bottom 38% |
|
||
| Premium | Premium | Premium |
Tourism (3)
| Name | Address |
|---|---|
| Bogong Horseback Adventures | 52 Fredas Ln, Tawonga VIC 3697, Australia |
| Mount Beauty Visitor Information Centre | Kiewa Valley Hwy |
| Mount Beauty Visitor Information Centre | Kiewa Valley Hwy |
Venues and Restaurants (2)
| Name | Address |
|---|---|
| Roi's Restaurant | |
| Templar Lodge | 181-183 Kiewa Valley Highway, Tawonga VIC 3697, Australia |
Education (1)
| Name | Address |
|---|---|
| Tawonga Primary School | 91-97 Kiewa Valley Highway, Tawonga VIC 3697, Australia |
Recreational Facilities (1)
| Name | Address |
|---|---|
| Saul Swags | Reids Ln, Tawonga VIC 3697, Australia |
Businesses (2)
| Name | Address |
|---|---|
| Templar Lodge | 181-183 Kiewa Valley Hwy |
| North Eastern Home Improvement Company | Kiewa Valley Hwy |
Loading entities ..