.png)
Profiles
Nearby Suburbs
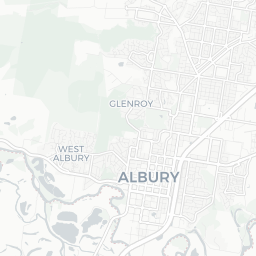
What Kind of People Live in Thurgoona NSW 2640?
Diversity Levels in Thurgoona
The proportion of the population who are not 3rd+ generation Anglo-Australians
Sources: ABS, TORREN and Microburbs, 2006 - 2023
Sources: ABS, TORREN and Microburbs, 2006 - 2023
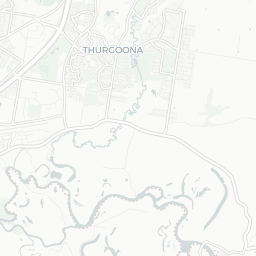
Thurgoona
18.9%
Thurgoona
18.9%
Murray
17.5%
Murray
17.5%
| Field | Value | VS Murray | Trend | |
|---|---|---|---|---|
| 34 | Bottom 13% |
|
||
| Premium | Premium | Premium | ||
| Premium | Premium | Premium | ||
| 2.9% | Top 33% |
|
||
| 14.5% | Bottom 47% |
|
Quality of Life in Thurgoona

The proportion of residents who enjoy a healthy, satisfying life.
Sources: ABS, AIHW, DSS, GEOSPATIAL, GOOGLE, TORREN and Microburbs, 2006 - 2045
Sources: ABS, AIHW, DSS, GEOSPATIAL, GOOGLE, TORREN and Microburbs, 2006 - 2045
Thurgoona
77.0%
Thurgoona
77.0%
Murray
73.4%
Murray
73.4%
| Field | Value | VS Murray | Trend | |
|---|---|---|---|---|
| 6 | Top 40% | Data for Jun 2023 | ||
| 80 | Top 15% | Data for Dec 2016 | ||
| 76.0 | Top 31% | Data for May 2023 | ||
| 40.0 | Top 30% | Data for May 2023 | ||
| 99.7% | Top 1% | Data for May 2023 | ||
| Premium | Premium | Premium |
Conservatism in Thurgoona
The proportion of the population who hold traditional values.
Sources: ABS, AEC and Microburbs, 2006 - 2023
Sources: ABS, AEC and Microburbs, 2006 - 2023
Thurgoona
38.9%
Thurgoona
38.9%
Murray
45.0%
Murray
45.0%
| Field | Value | VS Murray | Trend | |
|---|---|---|---|---|
| 57.0% | Top 46% | Data for May 2023 | ||
| 84.2% | Top 49% |
|
||
| 50.0% | Bottom 46% | Data for Dec 2022 |
Convenience Score in Thurgoona

The higher the score, the faster the travel time to regular amenities like work and shopping and the easier it is to access them without private cars.
Sources: ABS, GEOSPATIAL, TORREN and Microburbs, 2006 - 2045
Sources: ABS, GEOSPATIAL, TORREN and Microburbs, 2006 - 2045
Thurgoona
78.0
Thurgoona
78.0
Murray
68.5
Murray
68.5
| Field | Value | VS Murray | Trend | |
|---|---|---|---|---|
| 0.1% | Top 28% |
|
||
| 2.0 | Bottom 49% | 0 to Jan 2021 | ||
| 0.4% | Top 17% |
|
||
| 9 km | Bottom 14% | Data for Mar 2023 | ||
| 1.0% | Bottom 46% |
|
Hip Score in Thurgoona
The higher the score, the more fashionable and lively an area is: a trendy, progressive population with easy access to nightlife and culture.
Sources: ABS, AEC, GOOGLE and Microburbs, 2006 - 2023
Sources: ABS, AEC, GOOGLE and Microburbs, 2006 - 2023
Thurgoona
63.0
Thurgoona
63.0
Murray
60.0
Murray
60.0
| Field | Value | VS Murray | Trend | |
|---|---|---|---|---|
| 55% | Bottom 26% | Data for Nov 2017 | ||
| 1 | Top 41% | Data for Aug 2023 | ||
| 0.0 | Bottom 43% | Data for May 2023 | ||
| 43.0% | Bottom 44% |
|
||
| 2.6% | Top 32% |
|
||
| 46.0% | Bottom 48% | Data for Jan 2021 | ||
| 34.8% | Top 37% | Data for Dec 2022 | ||
| 0.1% | Top 18% |
|
Community Score in Thurgoona
The higher the score, the more time residents spend contributing the local community and the more connected residents are to their community.
Sources: ABS, GOOGLE and Microburbs, 2006 - 2023
Sources: ABS, GOOGLE and Microburbs, 2006 - 2023
Thurgoona
89.0
Thurgoona
89.0
Murray
86.5
Murray
86.5
| Field | Value | VS Murray | Trend | |
|---|---|---|---|---|
| 5.0 | Top 5% | Data for May 2023 | ||
| 94.0% | Bottom 35% | Data for Dec 2014 | ||
| 33.8% | Bottom 49% |
|
Family Score in Thurgoona
The higher the score, the more suitable the suburb is to families with children: good schools, safe, plentiful families, child-friendly amenities like playgrounds
Sources: ABS, DSS, TORREN and Microburbs, 2006 - 2023
Sources: ABS, DSS, TORREN and Microburbs, 2006 - 2023
Thurgoona
77.0
Thurgoona
77.0
Murray
68.2
Murray
68.2
| Field | Value | VS Murray | Trend | |
|---|---|---|---|---|
| 963 | Top 19% |
|
||
| 79.3% | Top 32% |
|
||
| 4.5% | Top 38% |
|
||
| Premium | Premium | Premium |
Health Services (35)
| Headline | Place | Datetime |
|---|---|---|
| Advanced Remedial Massage Therapies | 15 Oriole St | |
| Complete Wellness Personal Training | ||
| TONIC Kinesiology | 35 Slattery Pl | |
| Ray Walsh Acoustics Noise & Sound | ||
| Thurgoona Family Pharmacy | Shop 12 10 Shuter Ave |
Venues and Restaurants (10)
| Headline | Place | Datetime |
|---|---|---|
| Aromas | Shop 17/ 10 Shuter Ave | |
| Kinross Woolshed Hotel | 5 Kinross Ct | |
| Star Hotel Albury | Shopng Plz Shop 18/ 10 Shuter Ave | |
| Rossco's Italian Pizzeria | Shop 6 10 Shuter Ave | |
Education (14)
| Headline | Place | Datetime |
|---|---|---|
| Black Range Pony Club | 75 Roberts Rd | |
| Trinity Anglican College | 421 Elizabeth Mitchell Dr | |
| Thurgoona Pre-School Inc | 29 Bottlebrush St | |
Community Groups (7)
| Headline | Place | Datetime |
|---|---|---|
| Lyncare | 16 Ironbark Rd | |
| Thurgoona Baptist Church | Kosiosko Rd | |
| Thurgoona Community Centre | Cnr Kosciusko and Table Top Rds | |
| Thurgoona Community Complex | Cnr Kosciusko Andamp, Old Sydney Rds, | |
| SunnyCove Albury | 7 Severin Ct |
Businesses (40)
| Name | Address |
|---|---|
| Mobile Work Master | 7 The Mdw, Thurgoona NSW 2640, Australia |
| Chris Smith's Happy Gardeners | 8 Table Top Rd, Thurgoona NSW 2640, Australia |
| Upcycled Wood Designs | Unit 4B/39 Bennu Cct, Thurgoona NSW 2640, Australia |
| Southern Plumbing Plus | 51 Bennu Cct, Thurgoona NSW 2640, Australia |
| ROTOR SOLUTIONS AUSTRALIA | 16 Heron Ct, Thurgoona NSW 2640, Australia |
Tourism (1)
| Name | Address |
|---|---|
| Outback Spirit Tours | 93 Bennu Cct, Thurgoona NSW 2640, Australia |
Recreational Facilities (15)
| Name | Address |
|---|---|
| Starlings Dance Connections | 10 Kosciuszko Rd, Thurgoona NSW 2640, Australia |
| Kinross Woolshed Hotel | 5, Kinross Ct |
| Aero Refuellers | 22, Hoffmann Rd |
| Plus Fitness 24/7 Thurgoona | Shop 18 Thurgoona Plaza 10 Shutter Ave |
| Avenue Constructions |
Loading entities ..