.png)
Profiles
Nearby Suburbs
Real Estate Market: Is Bora Ridge NSW 2471 a Good Suburb to Buy Into?
Housing Market in Bora Ridge

Sources: Property Listings, TORREN and Microburbs, 2002 - 2023
| Field | Value | VS Richmond | Trend | |
|---|---|---|---|---|
| Premium | Premium | Premium | ||
| Premium | Premium | Premium | ||
| Premium | Premium | Premium | ||
| $643 | Top 40% |
|
||
| Premium | Premium | Premium |
Housing Supply in Bora Ridge

The higher the supply score the more supply is on the market, both current and future.
Sources: ABS, GEOSPATIAL, Property Listings, PLANNING ALERTS, BASIX and Microburbs, 2002 - 2031
Sources: ABS, GEOSPATIAL, Property Listings, PLANNING ALERTS, BASIX and Microburbs, 2002 - 2031
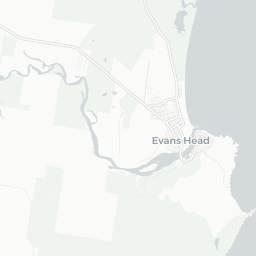
Bora Ridge
31.7%
Bora Ridge
31.7%
Richmond
36.4%
Richmond
36.4%
| Field | Value | VS Richmond | Trend | |
|---|---|---|---|---|
| 0 | Bottom 38% | Data for Jun 2025 | ||
| 0.0 | Bottom 10% | Data for Jul 2023 | ||
| Premium | Premium | Premium | ||
| Premium | Premium | Premium | ||
| Premium | Premium | Premium | ||
| 2 | Bottom 14% |
|
||
| Premium | Premium | Premium | ||
| Premium | Premium | Premium | ||
| Premium | Premium | Premium | ||
| 0 | Bottom 24% | Data for Mar 2025 |
Housing Stock Quality in Bora Ridge
The higher the score, the higher the quality of the houses and units.
Sources: ABS, GEOSPATIAL, Property Listings, BASIX and Microburbs, 2006 - 2023
Sources: ABS, GEOSPATIAL, Property Listings, BASIX and Microburbs, 2006 - 2023
| Field | Value | VS Richmond | Trend | |
|---|---|---|---|---|
| 100.0% | Top 31% | Data for Jan 2021 | ||
| 3.0 | Top 12% |
|
||
| 0.0% | Bottom 37% | Data for Jun 2023 |
Development Restrictions in Bora Ridge

The higher the score, the more easily density can be increased.
Sources: GEOSPATIAL, TORREN and Microburbs, 2011 - 2023
Sources: GEOSPATIAL, TORREN and Microburbs, 2011 - 2023
Bora Ridge
27.4%
Bora Ridge
27.4%
Richmond
30.9%
Richmond
30.9%
| Field | Value | VS Richmond | Trend | |
|---|---|---|---|---|
| 2.9% | Top 20% | Data for Jun 2023 | ||
| 0 | Bottom 16% | Data for Jun 2023 |
Risk in Bora Ridge

The higher the score, the more exposed households are to financial stress.
Sources: ABS, Property Listings, TORREN and Microburbs, 2006 - 2023
Sources: ABS, Property Listings, TORREN and Microburbs, 2006 - 2023
Bora Ridge
43.8
Bora Ridge
43.8
Richmond
51.3
Richmond
51.3
| Field | Value | VS Richmond | Trend | |
|---|---|---|---|---|
| 40 | Top 29% | Data for Jun 2023 | ||
| $2,610 | Top 19% |
|
||
| 69 | Bottom 10% | Data for Jun 2023 | ||
| 66 | Bottom 12% | Data for Jun 2023 | ||
| 30.8% | Top 14% |
|
||
| 41.0% | Top 43% |
|
Housing Demand in Bora Ridge
The higher the score, the more demand their is for housing in the area, both current and future.
Sources: ABS, TORREN, Property Listings and Microburbs, 2006 - 2030
Sources: ABS, TORREN, Property Listings and Microburbs, 2006 - 2030
Bora Ridge
41.7%
Bora Ridge
41.7%
Richmond
68.5%
Richmond
68.5%
| Field | Value | VS Richmond | Trend | |
|---|---|---|---|---|
| Premium | Premium | Premium | ||
| Premium | Premium | Premium | ||
| 6340 | Bottom 24% |
|
||
| 71600 | Top 43% |
|
||
| Premium | Premium | Premium | ||
| 24700 | Top 39% |
|
||
| Premium | Premium | Premium | ||
| Premium | Premium | Premium | ||
| Premium | Premium | Premium |
Unit Market in Bora Ridge
Sources: Property Listings and Microburbs, 2002 - 2023
| Field | Value | VS Richmond | Trend | |
|---|---|---|---|---|
| Premium | Premium | Premium | ||
| $412 | Bottom 27% |
|
||
| Premium | Premium | Premium | ||
| 87.0% | Top 18% |
|
Planning Applications: Dwellings (3)
| Headline | Place | Date |
|---|---|---|
| Section 4.55 (1a) modification to approved dwelling to include larger deck area and conversion of enclosed deck area into internal living space - Richmond Valley Council DA2019/0032.01 | 465 Myall Creek Road, Bora Ridge NSW 2471 | 14 Feb 2021 |
| Construction of a new dwelling to create a detached dual occupancy - Richmond Valley Council DA2021/0127 | 585 Myall Creek Road, Bora Ridge NSW 2471 | 30 Oct 2020 |
| BUSHFIRE AFFECTED - Relocated Dwelling + Deck - Richmond Valley Council DA2021/0099 | 585 Myall Creek Road, Bora Ridge NSW 2471 | 08 Oct 2020 |
LGA Details (1)
| Headline | Place | Datetime |
|---|---|---|
| Local government area | Richmond Valley |
Percent of Renters by Street (6)
| Percent of Renters | Street |
|---|---|
| 0.0% | Benauds Rd |
| 0.0% | Bloodwood Rd |
| 0.0% | Neileys Lagoon Rd |
| 0.0% | Haughwood Rd |
| 0.0% | Moffits Ln |
Turnover Rate by Street (5)
| Turnover rate | Street | Turnover Label | Turnover Years | Year |
|---|---|---|---|---|
| 87.5% | Myall Creek Rd | average turnover | Every 11.4 years (average turnover) | 2025 |
| 60.0% | Benauds Rd | quite tightly held | Every 16.7 years (quite tightly held) | 2025 |
| 140.0% | Haughwood Rd | very high turnover | Every 7.1 years (very high turnover) | 2025 |
| 133.3% | Bloodwood Rd | very high turnover | Every 7.5 years (very high turnover) | 2025 |
| 100.0% | Moffits Ln | high turnover | Every 10.0 years (high turnover) | 2025 |
Recently Sold Houses (14)
| Address | Price | Bedrooms | Bathrooms | Garage spaces | Date sold | Subdivisible into | Sale Type |
|---|---|---|---|---|---|---|---|
| 955 Myall Creek Rd | $650,000 | 4.0 | 2.0 | 2.0 | 15 Oct 2024 | 0 | On Market |
| 75 Haughwood Rd | $355,000 | 26 May 2023 | 0 | On Market | |||
| 75 Haughwood Rd | $355,000 | 2.0 | 1.0 | 26 May 2023 | 0 | On Market | |
| 430 Myall Creek Rd | $700,000 | 4.0 | 2.0 | 4.0 | 07 Feb 2022 | 0 | On Market |
| 430 Myall Creek Rd | $700,000 | 4.0 | 2.0 | 4.0 | 07 Feb 2022 | 0 | On Market |
Median House Sale Prices by Street (4)
| Street | Date | Median sale value |
|---|---|---|
| Myall Creek Rd | 06 Oct 2023 | $296,700 |
| Haughwood Rd | 06 Oct 2023 | $355,000 |
| Bloodwood Rd | 06 Oct 2023 | $323,100 |
| Benauds Rd | 06 Oct 2023 | $355,000 |
Recently Sold Units (100)
| Address | Price | Bedrooms | Bathrooms | Garage spaces | Date sold | Sale Type |
|---|---|---|---|---|---|---|
| 605 Myall Creek Rd | $680,000 | 1.0 | 15 Jan 2025 | On Market | ||
| 605 Myall Creek Rd | $680,000 | 0.0 | 1.0 | 2.0 | 15 Jan 2025 | On Market |
| 605 Myall Creek Rd | $680,000 | 0.0 | 1.0 | 2.0 | 15 Jan 2025 | On Market |
| 605 Myall Creek Rd | $680,000 | 0.0 | 1.0 | 2.0 | 15 Jan 2025 | On Market |
| 605 Myall Creek Rd | $680,000 | 1.0 | 15 Jan 2025 | On Market |
Loading entities ..