.png)
Profiles
Nearby Suburbs
Real Estate Market: Is Bulgarra WA 6714 a Good Suburb to Buy Into?
Housing Market in Bulgarra

Sources: Property Listings and Microburbs, 2002 - 2023
| Field | Value | VS Regional WA | Trend | |
|---|---|---|---|---|
| Premium | Premium | Premium | ||
| Premium | Premium | Premium | ||
| Premium | Premium | Premium | ||
| $1,040 | Top 3% |
|
||
| Premium | Premium | Premium |
Housing Supply in Bulgarra

The higher the supply score the more supply is on the market, both current and future.
Sources: ABS, GEOSPATIAL, Property Listings and Microburbs, 2002 - 2023
Sources: ABS, GEOSPATIAL, Property Listings and Microburbs, 2002 - 2023
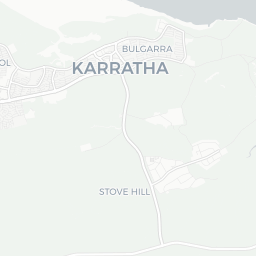
Bulgarra
58.4%
Bulgarra
58.4%
Regional WA
53.5%
Regional WA
53.5%
| Field | Value | VS Regional WA | Trend | |
|---|---|---|---|---|
| 0 | Bottom 38% | Data for Jun 2025 | ||
| 2.1 | Bottom 46% | Data for Jul 2023 | ||
| 18.5 | Top 23% | Data for May 2023 | ||
| Premium | Premium | Premium | ||
| Premium | Premium | Premium | ||
| Premium | Premium | Premium | ||
| Premium | Premium | Premium | ||
| Premium | Premium | Premium | ||
| 7 | Top 20% |
|
Housing Stock Quality in Bulgarra
The higher the score, the higher the quality of the houses and units.
Sources: ABS, GEOSPATIAL, Property Listings and Microburbs, 2006 - 2023
Sources: ABS, GEOSPATIAL, Property Listings and Microburbs, 2006 - 2023
| Field | Value | VS Regional WA | Trend | |
|---|---|---|---|---|
| 76.3% | Bottom 10% |
|
||
| 2.6 | Top 39% |
|
||
| 49.3% | Top 7% | Data for Jun 2023 |
Development Restrictions in Bulgarra

The higher the score, the more easily density can be increased.
Sources: GEOSPATIAL, TORREN, ABS and Microburbs, 2011 - 2023
Sources: GEOSPATIAL, TORREN, ABS and Microburbs, 2011 - 2023
Bulgarra
38.1%
Bulgarra
38.1%
Regional WA
28.5%
Regional WA
28.5%
| Field | Value | VS Regional WA | Trend | |
|---|---|---|---|---|
| 5.1 sq km | Bottom 42% | Data for Jan 2021 | ||
| 459 sqm per resident | Bottom 26% | Data for Jan 2021 |
Risk in Bulgarra

The higher the score, the more exposed households are to financial stress.
Sources: ABS, Property Listings, TORREN and Microburbs, 2006 - 2023
Sources: ABS, Property Listings, TORREN and Microburbs, 2006 - 2023
Bulgarra
56.7%
Bulgarra
56.7%
Regional WA
51.6%
Regional WA
51.6%
| Field | Value | VS Regional WA | Trend | |
|---|---|---|---|---|
| 79.1% | Bottom 15% |
|
||
| 20.9% | Top 15% |
|
||
| 17 | Bottom 4% | Data for Jun 2023 | ||
| $2,560 | Top 21% |
|
||
| 75 | Bottom 29% | Data for Jun 2023 | ||
| 74 | Bottom 36% | Data for Jun 2023 | ||
| 14.8% | Bottom 21% |
|
||
| 44.8% | Top 33% |
|
Housing Demand in Bulgarra
The higher the score, the more demand their is for housing in the area, both current and future.
Sources: ABS, TORREN, Property Listings and Microburbs, 1975 - 2030
Sources: ABS, TORREN, Property Listings and Microburbs, 1975 - 2030
Bulgarra
53.3%
Bulgarra
53.3%
Regional WA
40.5%
Regional WA
40.5%
| Field | Value | VS Regional WA | Trend | |
|---|---|---|---|---|
| Premium | Premium | Premium | ||
| Premium | Premium | Premium | ||
| 17900 | Top 23% |
|
||
| 32300 | Bottom 17% |
|
||
| Premium | Premium | Premium | ||
| 24400 | Top 39% |
|
||
| Premium | Premium | Premium | ||
| Premium | Premium | Premium | ||
| Premium | Premium | Premium | ||
| Premium | Premium | Premium |
Unit Market in Bulgarra
Sources: Property Listings and Microburbs, 2002 - 2023
| Field | Value | VS Regional WA | Trend | |
|---|---|---|---|---|
| Premium | Premium | Premium | ||
| $765 | Top 5% |
|
||
| Premium | Premium | Premium | ||
| 70.5% | Bottom 42% |
|
Accommodation Options (2)
| Headline | Place | Datetime |
|---|---|---|
| Searipple Karratha | Searipple Rd | |
Realtors (1)
| Headline | Place | Datetime |
|---|---|---|
| Rogerson K L | 733 Dolphin Way |
LGA Details (1)
| Headline | Place | Datetime |
|---|---|---|
| Local government area | Karratha |
Median House Rental Prices by Street (1)
| Level_0 | Street | Date | Median rent (per week) |
|---|---|---|---|
| 144910 | Melak St | 13 Mar 2025 | $1,000 |
Recently Sold Houses (100)
| Address | Price | Bedrooms | Bathrooms | Garage spaces | Date sold | Subdivisible into | Sale Type |
|---|---|---|---|---|---|---|---|
| 28 Samson Way | $480,000 | 3.0 | 1.0 | 2.0 | 18 Feb 2025 | 0 | On Market |
| 21 Viveash Way | $625,000 | 4.0 | 1.0 | 1.0 | 11 Feb 2025 | 0 | On Market |
| 53 Withnell Way | $395,000 | 4.0 | 1.0 | 7.0 | 31 Jan 2025 | 0 | On Market |
| 47 Kestral Way | $501,000 | 4.0 | 1.0 | 1.0 | 10 Jan 2025 | 0 | On Market |
| 47 Kestral Way | Price Withheld | 4.0 | 1.0 | 1.0 | 10 Jan 2025 | 0 | On Market |
Businesses (9)
| Name | Address |
|---|---|
| Pilbara Building Services | 127, Withnell Way |
| Mumford C | Sp 48238 Christie C Un 12 10 Walcott Way |
| Pilbara Fire Maintenance | |
| Pilbara Building Services | 127, Withnell Way |
| eLaRz real pics | 420, Turner Way |
Median Unit Sale Prices by Street (100)
| Date | Median sale value | Street |
|---|---|---|
| 25 Apr 2024 | $155,000 | Ridley St |
| 06 Oct 2023 | $249,000 | Withnell |
| 31 May 2024 | 532400.0 | Harding Way |
| 31 May 2024 | 486600.0 | Padbury Way |
| 31 May 2024 | 272700.0 | Richardson Way |
Percent of Renters by Street (52)
| Percent of Renters | Street |
|---|---|
| 100.0% | Andover None |
| 30.0% | Andover Way |
| 0.0% | Brockman St |
| 1.5% | Clarkson None |
| 17.1% | Clarkson Way |
Turnover Rate by Street (35)
| Turnover rate | Street | Turnover Label | Turnover Years | Year |
|---|---|---|---|---|
| 113.0% | Richardson Way | very high turnover | Every 8.9 years (very high turnover) | 2025 |
| 91.5% | Walcott Way | high turnover | Every 10.9 years (high turnover) | 2025 |
| 83.3% | Hall St | average turnover | Every 12.0 years (average turnover) | 2025 |
| 97.2% | Wellard Way | high turnover | Every 10.3 years (high turnover) | 2025 |
| 102.0% | Hunt Way | high turnover | Every 9.8 years (high turnover) | 2025 |
Median House Sale Prices by Street (100)
| Street | Date | Median sale value |
|---|---|---|
| Withnell | 10 May 2024 | $324,500 |
| Wellard | 10 May 2024 | $292,000 |
| Ridley St | 10 May 2024 | $315,000 |
| Hunt | 10 May 2024 | $520,000 |
| Hooley St | 10 May 2024 | $712,500 |
Recent Rental House Listings (100)
| Address | Rent (per week) | Bedrooms | Bathrooms | Garage spaces | Date | Subdivisible into |
|---|---|---|---|---|---|---|
| 22 Withnell Way | $750 | 3 | 1 | 0 | 24 Feb 2025 | 0 |
| 28 Samson Way | $880 | 3 | 1 | 5 | 20 Feb 2025 | 0 |
| 28 Samson Way | $925 | 3 | 1 | 5 | 20 Feb 2025 | 0 |
| 28 Samson Way | $880 | 3 | 1 | 5 | 20 Feb 2025 | 0 |
| 28 Samson Way | $880 | 3 | 1 | 5 | 20 Feb 2025 | 0 |
Recent Rental Unit Listings (100)
| Address | Rent (per week) | Bedrooms | Bathrooms | Garage spaces | Date |
|---|---|---|---|---|---|
| Unit 15, 23 Ridley St | $370 | 1.0 | 1.0 | 1.0 | 07 Jan 2025 |
| Unit 15, 23 Ridley St | $370 | 1.0 | 1.0 | 1.0 | 07 Jan 2025 |
| Unit 15, 23 Ridley St | $370 | 1.0 | 1.0 | 1.0 | 07 Jan 2025 |
| Unit 15, 23 Ridley St | $370 | 1.0 | 1.0 | 1.0 | 07 Jan 2025 |
| Unit 7, 41 Padbury Way | $650 | 1.0 | 1.0 | 1.0 | 06 Jan 2025 |
Recently Sold Units (100)
| Address | Price | Bedrooms | Bathrooms | Garage spaces | Date sold | Sale Type |
|---|---|---|---|---|---|---|
| Unit 3, 23 Wellard Way | Price Withheld | 2.0 | 1.0 | 1.0 | 04 Feb 2025 | On Market |
| Unit 3, 23 Wellard Way | Price Withheld | 2.0 | 1.0 | 1.0 | 04 Feb 2025 | On Market |
| Unit 3, 23 Wellard Way | Price Withheld | 2.0 | 1.0 | 1.0 | 04 Feb 2025 | On Market |
| Unit 3, 23 Wellard Way | Price Withheld | 2.0 | 1.0 | 1.0 | 04 Feb 2025 | On Market |
| Unit 3, 23 Wellard Way | Price Withheld | 2.0 | 1.0 | 1.0 | 04 Feb 2025 | On Market |
Loading entities ..