.png)
Profiles
Nearby Suburbs
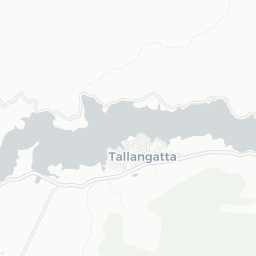
Real Estate Market: Is Bullioh VIC 3700 a Good Suburb to Buy Into?
Housing Market in Bullioh

Sources: Property Listings and Microburbs, 2002 - 2023
| Field | Value | VS Hume | Trend | |
|---|---|---|---|---|
| Premium | Premium | Premium | ||
| Premium | Premium | Premium | ||
| Premium | Premium | Premium | ||
| $535 | Bottom 31% |
|
||
| Premium | Premium | Premium |
Housing Supply in Bullioh

The higher the supply score the more supply is on the market, both current and future.
Sources: ABS, GEOSPATIAL, Property Listings and Microburbs, 2002 - 2023
Sources: ABS, GEOSPATIAL, Property Listings and Microburbs, 2002 - 2023
Bullioh
58.7%
Bullioh
58.7%
Hume
36.0%
Hume
36.0%
| Field | Value | VS Hume | Trend | |
|---|---|---|---|---|
| 0 | Bottom 38% | Data for Jun 2025 | ||
| 3.7 | Top 36% | Data for Jul 2023 | ||
| Premium | Premium | Premium | ||
| Premium | Premium | Premium | ||
| Premium | Premium | Premium | ||
| Premium | Premium | Premium | ||
| 0 | Bottom 25% | Data for Apr 2025 |
Housing Stock Quality in Bullioh
The higher the score, the higher the quality of the houses and units.
Sources: ABS, GEOSPATIAL, Property Listings and Microburbs, 2006 - 2023
Sources: ABS, GEOSPATIAL, Property Listings and Microburbs, 2006 - 2023
| Field | Value | VS Hume | Trend | |
|---|---|---|---|---|
| 100.0% | Top 31% | Data for Jan 2021 | ||
| 1.9 | Bottom 11% |
|
||
| 0.0% | Bottom 37% | Data for Jun 2023 |
Development Restrictions in Bullioh

The higher the score, the more easily density can be increased.
Sources: GEOSPATIAL, TORREN and Microburbs, 2011 - 2023
Sources: GEOSPATIAL, TORREN and Microburbs, 2011 - 2023
Bullioh
18.3%
Bullioh
18.3%
Hume
25.1%
Hume
25.1%
| Field | Value | VS Hume | Trend | |
|---|---|---|---|---|
| 1.6 sq km | Top 8% | Data for Jun 2023 |
Risk in Bullioh

The higher the score, the more exposed households are to financial stress.
Sources: ABS, Property Listings, TORREN and Microburbs, 2006 - 2023
Sources: ABS, Property Listings, TORREN and Microburbs, 2006 - 2023
Bullioh
23.3
Bullioh
23.3
Hume
32.1
Hume
32.1
| Field | Value | VS Hume | Trend | |
|---|---|---|---|---|
| 36 | Top 39% | Data for Jun 2023 | ||
| 75 | Bottom 31% | Data for Jun 2023 | ||
| 72 | Bottom 30% | Data for Jun 2023 | ||
| 25.9% | Top 30% |
|
Housing Demand in Bullioh
The higher the score, the more demand their is for housing in the area, both current and future.
Sources: ABS, TORREN, Property Listings and Microburbs, 2006 - 2030
Sources: ABS, TORREN, Property Listings and Microburbs, 2006 - 2030
Bullioh
28.0%
Bullioh
28.0%
Hume
49.4%
Hume
49.4%
| Field | Value | VS Hume | Trend | |
|---|---|---|---|---|
| Premium | Premium | Premium | ||
| Premium | Premium | Premium | ||
| 6290 | Bottom 21% |
|
||
| 77700 | Top 39% |
|
||
| Premium | Premium | Premium | ||
| 6180 | Bottom 36% |
|
||
| Premium | Premium | Premium | ||
| Premium | Premium | Premium | ||
| Premium | Premium | Premium |
Unit Market in Bullioh
Sources: Property Listings and Microburbs, 2002 - 2023
| Field | Value | VS Hume | Trend | |
|---|---|---|---|---|
| Premium | Premium | Premium | ||
| 133.0% | Top 2% |
|
LGA Details (1)
| Headline | Place | Datetime |
|---|---|---|
| Local government area | Towong |
Percent of Renters by Street (5)
| Percent of Renters | Street |
|---|---|
| 0.0% | Annandale Rd |
| 0.0% | Bullioh Rd |
| 12.2% | Hindleton Rd |
| 0.0% | Moscrops Rd |
| 0.0% | Murray Valley Hwy |
Turnover Rate by Street (4)
| Turnover rate | Street | Turnover Label | Turnover Years | Year |
|---|---|---|---|---|
| 64.3% | Murray Valley Hwy | quite tightly held | Every 15.6 years (quite tightly held) | 2025 |
| 62.5% | Hindleton Rd | quite tightly held | Every 16.0 years (quite tightly held) | 2025 |
| 300.0% | Bullioh Rd | very high turnover | Every 3.3 years (very high turnover) | 2025 |
| 100.0% | Annandale Rd | high turnover | Every 10.0 years (high turnover) | 2025 |
Recently Sold Houses (7)
| Address | Price | Bedrooms | Bathrooms | Garage spaces | Date sold | Subdivisible into | Sale Type |
|---|---|---|---|---|---|---|---|
| 123 Hindleton Rd | Price Withheld | 3.0 | 1.0 | 2.0 | 20 Sep 2024 | 0 | On Market |
| 123 Hindleton Rd | $890,000 | 3.0 | 1.0 | 2.0 | 20 Sep 2024 | 0 | On Market |
| 123 Hindleton Rd | Price Withheld | 3.0 | 1.0 | 2.0 | 02 Aug 2024 | 0 | On Market |
| 7885 Murray Valley Hwy | $960,000 | 3.0 | 2.0 | 13 Jan 2023 | 0 | On Market | |
| 7885 Murray Valley Hwy | Price Withheld | 3.0 | 2.0 | 0.0 | 13 Jan 2023 | 0 | On Market |
Median House Sale Prices by Street (1)
| Street | Date | Median sale value |
|---|---|---|
| Murray Valley Hwy | 06 Oct 2023 | $579,500 |
Recent Rental House Listings (100)
| Address | Rent (per week) | Bedrooms | Bathrooms | Garage spaces | Date | Subdivisible into |
|---|---|---|---|---|---|---|
| 212 Hindleton Rd | $200 | 11 Mar 2019 | 0 | |||
| 212 Hindleton Rd | $200 | 11 Mar 2019 | 0 | |||
| 212 Hindleton Rd | $200 | 11 Mar 2019 | 0 | |||
| 212 Hindleton Rd | $200 | 11 Mar 2019 | 0 | |||
| 212 Hindleton Rd | $200 | 11 Mar 2019 | 0 |
Recently Sold Units (100)
| Address | Price | Bedrooms | Bathrooms | Garage spaces | Date sold | Sale Type |
|---|---|---|---|---|---|---|
| 123 Hindleton Rd | Price Withheld | 3.0 | 1.0 | 2.0 | 20 Sep 2024 | On Market |
| 123 Hindleton Rd | Price Withheld | 3.0 | 1.0 | 2.0 | 20 Sep 2024 | On Market |
| 123 Hindleton Rd | Price Withheld | 3.0 | 1.0 | 2.0 | 20 Sep 2024 | On Market |
| 123 Hindleton Rd | Price Withheld | 3.0 | 1.0 | 2.0 | 20 Sep 2024 | On Market |
| 123 Hindleton Rd | Price Withheld | 3.0 | 1.0 | 2.0 | 20 Sep 2024 | On Market |
Loading entities ..