.png)
Profiles
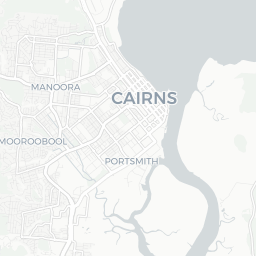
Nearby Suburbs
Real Estate Market: Is Bungalow QLD 4870 a Good Suburb to Buy Into?
Housing Market in Bungalow

Sources: Property Listings and Microburbs, 2002 - 2023
| Field | Value | VS Cairns | Trend | |
|---|---|---|---|---|
| Premium | Premium | Premium | ||
| Premium | Premium | Premium | ||
| Premium | Premium | Premium | ||
| $700 | Top 15% |
|
||
| Premium | Premium | Premium |
Housing Supply in Bungalow

The higher the supply score the more supply is on the market, both current and future.
Sources: ABS, GEOSPATIAL, Property Listings, PLANNING ALERTS and Microburbs, 2002 - 2023
Sources: ABS, GEOSPATIAL, Property Listings, PLANNING ALERTS and Microburbs, 2002 - 2023
Bungalow
28.7%
Bungalow
28.7%
Cairns
39.8%
Cairns
39.8%
| Field | Value | VS Cairns | Trend | |
|---|---|---|---|---|
| 102 | Top 18% |
|
||
| 0.2 | Bottom 23% | Data for Jul 2023 | ||
| 17.0 | Top 24% | Data for May 2023 | ||
| Premium | Premium | Premium | ||
| Premium | Premium | Premium | ||
| Premium | Premium | Premium | ||
| Premium | Premium | Premium | ||
| Premium | Premium | Premium | ||
| 10 | Top 7% |
|
Housing Stock Quality in Bungalow
The higher the score, the higher the quality of the houses and units.
Sources: ABS, GEOSPATIAL, Property Listings and Microburbs, 2006 - 2023
Sources: ABS, GEOSPATIAL, Property Listings and Microburbs, 2006 - 2023
| Field | Value | VS Cairns | Trend | |
|---|---|---|---|---|
| 42.6% | Bottom 3% |
|
||
| 2.0 | Bottom 15% |
|
||
| 24.6% | Top 11% | Data for Jun 2023 |
Development Restrictions in Bungalow

The higher the score, the more easily density can be increased.
Sources: GEOSPATIAL, TORREN, ABS and Microburbs, 2011 - 2023
Sources: GEOSPATIAL, TORREN, ABS and Microburbs, 2011 - 2023
Bungalow
47.9%
Bungalow
47.9%
Cairns
37.5%
Cairns
37.5%
| Field | Value | VS Cairns | Trend | |
|---|---|---|---|---|
| 2.2 sq km | Bottom 23% | Data for Jan 2021 | ||
| 0.0 sq km | Bottom 39% | Data for Jun 2023 | ||
| 328 sqm per resident | Bottom 12% | Data for Jan 2021 |
Risk in Bungalow

The higher the score, the more exposed households are to financial stress.
Sources: ABS, Property Listings, TORREN and Microburbs, 2006 - 2023
Sources: ABS, Property Listings, TORREN and Microburbs, 2006 - 2023
Bungalow
53.3
Bungalow
53.3
Cairns
50.3
Cairns
50.3
| Field | Value | VS Cairns | Trend | |
|---|---|---|---|---|
| 68.8% | Bottom 5% |
|
||
| 31.2% | Top 5% |
|
||
| 32 | Bottom 48% | Data for Jun 2023 | ||
| $1,440 | Bottom 25% |
|
||
| 74 | Bottom 26% | Data for Jun 2023 | ||
| 76 | Bottom 49% | Data for Jun 2023 | ||
| 28.1% | Top 21% |
|
||
| 21.8% | Bottom 9% |
|
Housing Demand in Bungalow
The higher the score, the more demand their is for housing in the area, both current and future.
Sources: ABS, TORREN, Property Listings and Microburbs, 1975 - 2030
Sources: ABS, TORREN, Property Listings and Microburbs, 1975 - 2030
Bungalow
67.5%
Bungalow
67.5%
Cairns
58.6%
Cairns
58.6%
| Field | Value | VS Cairns | Trend | |
|---|---|---|---|---|
| Premium | Premium | Premium | ||
| Premium | Premium | Premium | ||
| 8790 | Bottom 47% |
|
||
| 110000 | Top 22% |
|
||
| Premium | Premium | Premium | ||
| 198000 | Top 7% |
|
||
| Premium | Premium | Premium | ||
| Premium | Premium | Premium | ||
| Premium | Premium | Premium | ||
| Premium | Premium | Premium |
Unit Market in Bungalow
Sources: Property Listings and Microburbs, 2002 - 2023
| Field | Value | VS Cairns | Trend | |
|---|---|---|---|---|
| Premium | Premium | Premium | ||
| $435 | Bottom 35% |
|
||
| Premium | Premium | Premium | ||
| 45.8% | Bottom 2% |
|
Median House Rental Prices by Street (8)
| Street | Date | Median rent (per week) |
|---|---|---|
| Joan St | 06 Mar 2025 | $517 |
| Buchan St | 06 Mar 2025 | $620 |
| Allan St | 06 Mar 2025 | $565 |
| Aumuller St | 06 Mar 2025 | $405 |
| Morehead St | 06 Mar 2025 | $660 |
Realtors (4)
| Headline | Place | Datetime |
|---|---|---|
| Coates | 154 Buchan St | |
| First National Real Estate Cairns Central and Cairns Beaches | Suite 1 155 Mulgrave Rd | |
| Go Commercial | Unit 6 175-185 Newell St | |
| Taylor Jones Property | 152 Buchan St |
Accommodation Options (1)
| Headline | Place | Datetime |
|---|---|---|
| Hunt Realty | Ground Floor 187 Mulgrave Rd |
Businesses (100)
| Name | Address |
|---|---|
| Boscon Constructions Pty Ltd | 57 Scott St, Bungalow QLD 4870, Australia |
| Freedom Constructions | 160 Buchan St, Bungalow QLD 4870, Australia |
| Formosa Construction & Fabrication | 14 Barry St, Bungalow QLD 4870, Australia |
| Collins Phillips | 173 Scott St, Bungalow QLD 4870, Australia |
| Active Fencing Company | Shed 5/149 Newell St, Bungalow QLD 4870, Australia |
Planning Applications: Other (76)
| Headline | Place | Date |
|---|---|---|
| Material Change of Use Medium Impact Industry & Caretaker's Accommodation - Cairns Regional Council 13311/2025 | 74 Morehead Street Bungalow QLD 4870 | 27 Feb 2025 |
| Material Change of Use Home Based Business - Cairns Regional Council 13267/2025 | 18 Edgar Street Bungalow QLD 4870 | 30 Jan 2025 |
| Operational Works - On Street Works Access Crossover & Driveway - Cairns Regional Council 13231/2024 | 169-175 Spence Street Bungalow QLD 4870 | 20 Dec 2024 |
| Change Application (Minor) Material Change of Use (Industry Class A) - Cairns Regional Council 13216/2024 | 235-245 Mulgrave Road Bungalow QLD 4870 | 11 Dec 2024 |
| Change Application (Minor) Material Change of Use (Health Care Services) - Cairns Regional Council 13187/2024 | 211-217 Mulgrave Road Bungalow QLD 4870 | 22 Nov 2024 |
Planning Applications: Industrial (14)
| Headline | Place | Date |
|---|---|---|
| Combined Application Material Change of Use for Low Impact Industry and Warehouse and Reconfiguring a Lot 2 Lots into 3 Lots - Cairns Regional Council 13273/2025 | 1 Kidston Street Bungalow QLD 4870 | 05 Feb 2025 |
| Material Change of Use Transport Depot, Warehouse and Indoor Sport and Recreation - Cairns Regional Council 13207/2024 | 169-175 Spence Street Bungalow QLD 4870 | 06 Dec 2024 |
| Material Change of Use Medium Impact Industry, Transport Depot & Warehouse - Cairns Regional Council 13090/2024 | 104-120 Newell Street Bungalow QLD 4870 | 25 Sep 2024 |
| Combined Application Material Change of Use (Low Impact Industry, Medium Impact Industry and Warehouse) & Reconfiguring a Lot (Creation of 2 Access Easements) - Cairns Regional Council 12548/2023 | 153-155 Lyons Street Bungalow QLD 4870 | 19 Oct 2023 |
| Material Change of Use Low Impact Industy & Warehouse (Non-Compliance of 1-3 Acceptable Outcomes) - Cairns Regional Council 12100/2023 | 28 Dillon Street Bungalow QLD 4870 | 13 Jan 2023 |
Planning Applications: Dwellings (6)
| Headline | Place | Date |
|---|---|---|
| Change Application (Minor) Material Change of Use (Dual Occupancy) - Cairns Regional Council 13033/2024 | 16B Kidston Street Bungalow QLD 4870 | 23 Aug 2024 |
| Change Application (Minor) Office & Dwelling Unit - Cairns Regional Council 12741/2024 | 177 Aumuller Street Bungalow QLD 4870 | 07 Mar 2024 |
| Combined Application Reconfiguration a Lot (1 lot into 2 lots) and Material Change of Use for Multiple dwelling - Cairns Regional Council 12526/2023 | 187 Mulgrave Road Bungalow QLD 4870 | 10 Oct 2023 |
| Material Change of Use Dual Occupancy - Cairns Regional Council 11827/2022 | 7 Barrett Street Bungalow QLD 4870 | 12 Jul 2022 |
| Change Application (Minor) Multiple Dwelling - Cairns Regional Council 11399/2021 | 241-245 McCoombe Street Bungalow QLD 4870 | 09 Nov 2021 |
Recently Sold Houses (100)
| Address | Price | Bedrooms | Bathrooms | Garage spaces | Date sold | Subdivisible into | Sale Type |
|---|---|---|---|---|---|---|---|
| 42 Hannam St | $490,000 | 2.0 | 1.0 | 0.0 | 06 Feb 2025 | 0 | On Market |
| 256 Spence St | $480,000 | 3.0 | 1.0 | 1.0 | 03 Feb 2025 | 0 | On Market |
| 9 Dillon St | $460,000 | 2.0 | 1.0 | 4.0 | 23 Dec 2024 | 0 | On Market |
| 9 Dillon St | Price Withheld | 2.0 | 1.0 | 4.0 | 23 Dec 2024 | 0 | On Market |
| 19 Dalton St | $699,000 | 3.0 | 2.0 | 2.0 | 18 Dec 2024 | 0 | On Market |
Median House Sale Prices by Street (100)
| Street | Date | Median sale value |
|---|---|---|
| Scott St | 10 May 2024 | $460,000 |
| Dalton St | 10 May 2024 | $520,000 |
| Kidston St | 10 May 2024 | $663,500 |
| Bunting St | 10 May 2024 | $512,500 |
| Buchan St | 10 May 2024 | $567,500 |
LGA Details (1)
| Headline | Place | Datetime |
|---|---|---|
| Local government area | Cairns |
Turnover Rate by Street (38)
| Turnover rate | Street | Turnover Label | Turnover Years | Year |
|---|---|---|---|---|
| 67.2% | Morehead St | average turnover | Every 14.9 years (average turnover) | 2025 |
| 68.5% | Kidston St | average turnover | Every 14.6 years (average turnover) | 2025 |
| 68.1% | Wilks St | average turnover | Every 14.7 years (average turnover) | 2025 |
| 85.0% | Aumuller St | average turnover | Every 11.8 years (average turnover) | 2025 |
| 104.2% | Edgar St | high turnover | Every 9.6 years (high turnover) | 2025 |
Percent of Renters by Street (40)
| Percent of Renters | Street |
|---|---|
| 60.7% | Allan St |
| 37.4% | Aumuller St |
| 41.2% | Barrett St |
| 40.9% | Barry St |
| 40.6% | Bell St |
Median Unit Sale Prices by Street (100)
| Date | Median sale value | Street |
|---|---|---|
| 10 May 2024 | $210,000 | Bell St |
| 10 May 2024 | $1,420,000 | Joan St |
| 10 May 2024 | $210,000 | Aumuller St |
| 10 May 2024 | $170,100 | Kidston St |
| 10 May 2024 | $299,000 | Spence St |
Recent Rental Unit Listings (100)
| Address | Rent (per week) | Bedrooms | Bathrooms | Garage spaces | Date |
|---|---|---|---|---|---|
| Unit 6, 190-192 Buchan St | $395 | 1.0 | 1.0 | 1.0 | 20 Feb 2025 |
| Unit 6, 190-192 Buchan St | $395 | 1.0 | 1.0 | 1.0 | 20 Feb 2025 |
| Unit 6, 190-192 Buchan St | $395 | 1.0 | 1.0 | 1.0 | 20 Feb 2025 |
| Unit 2, 12 Allan St | $325 | 1.0 | 1.0 | 0.0 | 29 Jan 2025 |
| Unit 2, 12 Allan St | $325 | 1.0 | 1.0 | 0.0 | 29 Jan 2025 |
Recent Rental House Listings (100)
| Address | Rent (per week) | Bedrooms | Bathrooms | Garage spaces | Date | Subdivisible into |
|---|---|---|---|---|---|---|
| Unit 2, 131 Aumuller St | $440 | 2 | 1 | 1 | 18 Feb 2025 | 0 |
| 139 Aumuller St | $680 | 4 | 2 | 3 | 23 Jan 2025 | 0 |
| 139 Aumuller St | $680 | 4 | 2 | 3 | 23 Jan 2025 | 0 |
| 139 Aumuller St | $680 | 4 | 2 | 3 | 23 Jan 2025 | 0 |
| 139 Aumuller St | $680 | 4 | 2 | 3 | 23 Jan 2025 | 0 |
Recently Sold Units (100)
| Address | Price | Bedrooms | Bathrooms | Garage spaces | Date sold | Sale Type |
|---|---|---|---|---|---|---|
| Unit 5, 120 Aumuller St | $203,000 | 1.0 | 1.0 | 1.0 | 29 Jan 2025 | On Market |
| Unit 5, 120 Aumuller St | $203,000 | 1.0 | 1.0 | 1.0 | 29 Jan 2025 | On Market |
| Unit 5, 120 Aumuller St | $203,000 | 1.0 | 1.0 | 1.0 | 29 Jan 2025 | On Market |
| Unit 29, 201 Aumuller St | $292,000 | 2.0 | 2.0 | 1.0 | 28 Jan 2025 | On Market |
| Unit 29, 201 Aumuller St | $292,000 | 2.0 | 2.0 | 1.0 | 28 Jan 2025 | On Market |
Loading entities ..