.png)
Profiles
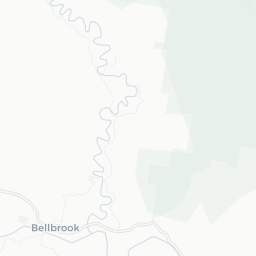
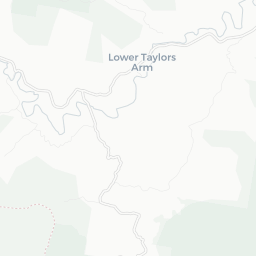
Nearby Suburbs
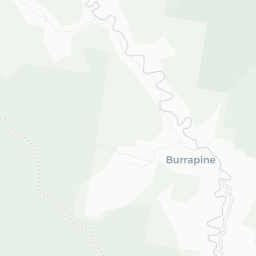
Real Estate Market: Is Burrapine NSW 2447 a Good Suburb to Buy Into?
Housing Market in Burrapine

Sources: Property Listings and Microburbs, 2002 - 2023
| Field | Value | VS Mid North Coast NSW | Trend | |
|---|---|---|---|---|
| Premium | Premium | Premium | ||
| Premium | Premium | Premium | ||
| Premium | Premium | Premium | ||
| $514 | Bottom 26% |
|
||
| Premium | Premium | Premium |
Housing Supply in Burrapine

The higher the supply score the more supply is on the market, both current and future.
Sources: ABS, GEOSPATIAL, Property Listings, PLANNING ALERTS, BASIX and Microburbs, 2002 - 2031
Sources: ABS, GEOSPATIAL, Property Listings, PLANNING ALERTS, BASIX and Microburbs, 2002 - 2031
Burrapine
56.5%
Burrapine
56.5%
Mid North Coast NSW
41.1%
Mid North Coast NSW
41.1%
| Field | Value | VS Mid North Coast NSW | Trend | |
|---|---|---|---|---|
| 0 | Bottom 38% | Data for Jun 2025 | ||
| 6.7 | Top 23% | Data for Jul 2023 | ||
| Premium | Premium | Premium | ||
| Premium | Premium | Premium | ||
| Premium | Premium | Premium | ||
| 4 | Bottom 13% | Data for Dec 2018 | ||
| Premium | Premium | Premium | ||
| Premium | Premium | Premium | ||
| Premium | Premium | Premium | ||
| 1 | Top 44% |
|
Housing Stock Quality in Burrapine
The higher the score, the higher the quality of the houses and units.
Sources: ABS, GEOSPATIAL, Property Listings, BASIX and Microburbs, 2006 - 2023
Sources: ABS, GEOSPATIAL, Property Listings, BASIX and Microburbs, 2006 - 2023
| Field | Value | VS Mid North Coast NSW | Trend | |
|---|---|---|---|---|
| 100.0% | Top 31% | Data for Jan 2021 | ||
| 2.0 | Bottom 15% |
|
||
| 0.0% | Bottom 37% | Data for Jun 2023 |
Development Restrictions in Burrapine

The higher the score, the more easily density can be increased.
Sources: GEOSPATIAL, TORREN and Microburbs, 2011 - 2023
Sources: GEOSPATIAL, TORREN and Microburbs, 2011 - 2023
Burrapine
19.1%
Burrapine
19.1%
Mid North Coast NSW
24.0%
Mid North Coast NSW
24.0%
| Field | Value | VS Mid North Coast NSW | Trend | |
|---|---|---|---|---|
| 0.0% | Bottom 31% | Data for Jun 2023 | ||
| 0 | Bottom 16% | Data for Jun 2023 |
Risk in Burrapine

The higher the score, the more exposed households are to financial stress.
Sources: ABS, Property Listings, TORREN and Microburbs, 2006 - 2023
Sources: ABS, Property Listings, TORREN and Microburbs, 2006 - 2023
Burrapine
40.3
Burrapine
40.3
Mid North Coast NSW
43.2
Mid North Coast NSW
43.2
| Field | Value | VS Mid North Coast NSW | Trend | |
|---|---|---|---|---|
| 100.0% | Top 11% | Data for May 2023 | ||
| 0.0% | Bottom 11% | Data for May 2023 | ||
| 34 | Top 45% | Data for Jun 2023 | ||
| $2,650 | Top 18% |
|
||
| 76 | Bottom 34% | Data for Jun 2023 | ||
| 77 | Top 40% | Data for Jun 2023 | ||
| 49.5% | Top 2% |
|
||
| 40.2% | Top 45% |
|
Housing Demand in Burrapine
The higher the score, the more demand their is for housing in the area, both current and future.
Sources: ABS, TORREN, Property Listings and Microburbs, 2006 - 2030
Sources: ABS, TORREN, Property Listings and Microburbs, 2006 - 2030
Burrapine
30.4%
Burrapine
30.4%
Mid North Coast NSW
60.8%
Mid North Coast NSW
60.8%
| Field | Value | VS Mid North Coast NSW | Trend | |
|---|---|---|---|---|
| Premium | Premium | Premium | ||
| 8130 | Bottom 34% |
|
||
| 52300 | Bottom 37% |
|
||
| Premium | Premium | Premium | ||
| 20800 | Top 40% |
|
||
| Premium | Premium | Premium | ||
| Premium | Premium | Premium |
Unit Market in Burrapine
Sources: Property Listings and Microburbs, 2002 - 2023
| Field | Value | VS Mid North Coast NSW | Trend | |
|---|---|---|---|---|
| Premium | Premium | Premium | ||
| $318 | Bottom 2% |
|
||
| Premium | Premium | Premium | ||
| 123.0% | Top 5% |
|
LGA Details (1)
| Headline | Place | Datetime |
|---|---|---|
| Local government area | Nambucca Valley |
Turnover Rate by Street (3)
| Turnover rate | Street | Turnover Label | Turnover Years | Year |
|---|---|---|---|---|
| 82.4% | Taylors Arm Rd | average turnover | Every 12.1 years (average turnover) | 2025 |
| 75.0% | Apple Tree None | average turnover | Every 13.3 years (average turnover) | 2025 |
| 100.0% | Kestrel Rd | high turnover | Every 10.0 years (high turnover) | 2025 |
Percent of Renters by Street (4)
| Percent of Renters | Street |
|---|---|
| 0.0% | Apple Tree None |
| 0.0% | Kestrel Rd |
| 0.0% | Sheet O Bark Rd |
| 7.3% | Taylors Arm Rd |
Recently Sold Houses (11)
| Address | Price | Bedrooms | Bathrooms | Garage spaces | Date sold | Subdivisible into | Sale Type |
|---|---|---|---|---|---|---|---|
| 3953 Taylors Arm Rd | Price Withheld | 21 Mar 2023 | 0 | On Market | |||
| 3897 Taylors Arm Rd | $165,000 | 29 Sep 2021 | 0 | On Market | |||
| 3718 Taylors Arm Rd | $300,000 | 2.0 | 1.0 | 30 Sep 2020 | 0 | On Market | |
| 3718 Taylors Arm Rd | Price Withheld | 2.0 | 1.0 | 30 Sep 2020 | 0 | On Market | |
| 3718 Taylors Arm Rd | $300,000 | 2.0 | 1.0 | 30 Sep 2020 | 0 | On Market |
Median House Sale Prices by Street (11)
| Street | Date | Median sale value |
|---|---|---|
| Taylors Arm Rd | 31 May 2024 | 94760.0 |
| Taylors Arm Rd | 31 Jul 2024 | 397900.0 |
| Taylors Arm Rd | 31 Jan 2025 | 369300.0 |
| Taylors Arm Rd | 31 Jan 2025 | 418600.0 |
| Taylors Arm Rd | 31 Aug 2024 | 321700.0 |
Recently Sold Units (100)
| Address | Price | Bedrooms | Bathrooms | Garage spaces | Date sold | Sale Type |
|---|---|---|---|---|---|---|
| 3953 Taylors Arm Rd | Price Withheld | 21 Mar 2023 | On Market | |||
| 3953 Taylors Arm Rd | Price Withheld | 21 Mar 2023 | On Market | |||
| 3953 Taylors Arm Rd | Price Withheld | 21 Mar 2023 | On Market | |||
| 3953 Taylors Arm Rd | Price Withheld | 21 Mar 2023 | On Market | |||
| 3953 Taylors Arm Rd | Price Withheld | 21 Mar 2023 | On Market |
Loading entities ..