.png)
Profiles
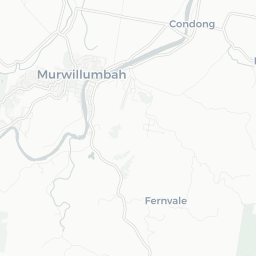
Nearby Suburbs
Real Estate Market: Is Condong NSW 2484 a Good Suburb to Buy Into?
Housing Market in Condong

Sources: Property Listings, TORREN and Microburbs, 2002 - 2023
| Field | Value | VS Richmond | Trend | |
|---|---|---|---|---|
| Premium | Premium | Premium | ||
| Premium | Premium | Premium | ||
| Premium | Premium | Premium | ||
| $862 | Top 9% |
|
||
| Premium | Premium | Premium |
Housing Supply in Condong

The higher the supply score the more supply is on the market, both current and future.
Sources: ABS, GEOSPATIAL, Property Listings, PLANNING ALERTS, BASIX and Microburbs, 2002 - 2031
Sources: ABS, GEOSPATIAL, Property Listings, PLANNING ALERTS, BASIX and Microburbs, 2002 - 2031
Condong
43.4%
Condong
43.4%
Richmond
36.4%
Richmond
36.4%
| Field | Value | VS Richmond | Trend | |
|---|---|---|---|---|
| 1,410 | Top 3% |
|
||
| 5.1 | Top 29% | Data for Jul 2023 | ||
| Premium | Premium | Premium | ||
| Premium | Premium | Premium | ||
| 4 | Bottom 34% | Data for Dec 2020 | ||
| Premium | Premium | Premium | ||
| Premium | Premium | Premium | ||
| Premium | Premium | Premium | ||
| 1 | Top 42% |
|
Housing Stock Quality in Condong
The higher the score, the higher the quality of the houses and units.
Sources: ABS, GEOSPATIAL, Property Listings, BASIX and Microburbs, 2006 - 2023
Sources: ABS, GEOSPATIAL, Property Listings, BASIX and Microburbs, 2006 - 2023
| Field | Value | VS Richmond | Trend | |
|---|---|---|---|---|
| 100.0% | Top 31% |
|
||
| 2.9 | Top 17% |
|
||
| 0.4% | Top 22% | Data for Jun 2023 |
Development Restrictions in Condong

The higher the score, the more easily density can be increased.
Sources: GEOSPATIAL, TORREN, ABS and Microburbs, 2011 - 2023
Sources: GEOSPATIAL, TORREN, ABS and Microburbs, 2011 - 2023
Condong
21.6%
Condong
21.6%
Richmond
30.9%
Richmond
30.9%
| Field | Value | VS Richmond | Trend | |
|---|---|---|---|---|
| 7.3 sq km | Bottom 49% | Data for Jan 2021 | ||
| 0.82 | Top 34% | Data for Feb 2023 | ||
| 0.0% | Bottom 31% | Data for Jun 2023 | ||
| 5 | Top 26% | Data for Jun 2023 | ||
| 10500 sqm per resident | Top 16% | Data for Jan 2021 |
Risk in Condong

The higher the score, the more exposed households are to financial stress.
Sources: ABS, Property Listings, TORREN and Microburbs, 2006 - 2023
Sources: ABS, Property Listings, TORREN and Microburbs, 2006 - 2023
Condong
60.6%
Condong
60.6%
Richmond
62.3%
Richmond
62.3%
| Field | Value | VS Richmond | Trend | |
|---|---|---|---|---|
| 90.9% | Bottom 45% | 0 to May 2023 | ||
| 9.1% | Top 45% |
|
||
| 54 | Top 10% | Data for Jun 2023 | ||
| $1,870 | Bottom 46% |
|
||
| 57 | Bottom 1% | Data for Jun 2023 | ||
| 51 | Bottom 1% | Data for Jun 2023 | ||
| 27.1% | Top 25% |
|
||
| 63.2% | Top 5% |
|
Housing Demand in Condong
The higher the score, the more demand their is for housing in the area, both current and future.
Sources: ABS, TORREN, Property Listings and Microburbs, 1975 - 2030
Sources: ABS, TORREN, Property Listings and Microburbs, 1975 - 2030
Condong
67.4%
Condong
67.4%
Richmond
68.5%
Richmond
68.5%
| Field | Value | VS Richmond | Trend | |
|---|---|---|---|---|
| Premium | Premium | Premium | ||
| Premium | Premium | Premium | ||
| 9760 | Bottom 41% |
|
||
| 99000 | Top 28% |
|
||
| Premium | Premium | Premium | ||
| 110000 | Top 15% |
|
||
| Premium | Premium | Premium | ||
| Premium | Premium | Premium | ||
| Premium | Premium | Premium |
Unit Market in Condong
Sources: Property Listings and Microburbs, 2002 - 2023
| Field | Value | VS Richmond | Trend | |
|---|---|---|---|---|
| Premium | Premium | Premium | ||
| 41.1% | Bottom 4% |
|
Recently Sold Houses (97)
| Address | Price | Bedrooms | Bathrooms | Garage spaces | Date sold | Subdivisible into | Sale Type |
|---|---|---|---|---|---|---|---|
| 11 Tweed Valley Way | Price Withheld | 5.0 | 2.0 | 8.0 | 18 Mar 2025 | 0 | On Market |
| 49 Eviron Rd | $800,000 | 3.0 | 3.0 | 3.0 | 24 Feb 2025 | 0 | On Market |
| 54 Clothiers Creek Rd | Price Withheld | 3.0 | 2.0 | 6.0 | 18 Nov 2024 | 0 | On Market |
| 54 Clothiers Creek Rd | $855,000 | 3.0 | 2.0 | 6.0 | 18 Nov 2024 | 0 | On Market |
| 61 Mcleod St | $1,050,000 | 3.0 | 3.0 | 4.0 | 28 Oct 2024 | 0 | On Market |
Planning Applications: Dwellings (13)
| Headline | Place | Date |
|---|---|---|
| Alterations and additions to an existing dwelling including house raising - Tweed Shire Council DA24/0483 | 28 Colonial Drive, Condong NSW 2484 | 16 Oct 2024 |
| Alterations and additions to an existing dwelling including house raise and swimming pool - Tweed Shire Council DA24/0459 | 67 McLeod Street, Condong NSW 2484 | 02 Oct 2024 |
| Amendment to Development Consent DA22/0220 for alterations and additions to existing dwelling including house-raising - Tweed Shire Council DA22/0220.01 | 7 Tweed Valley Way, Condong NSW 2484 | 02 Aug 2024 |
| Construction of flood mitigation bund wall to Condong Sugar Mill - Tweed Shire Council DA24/0301 | 123 McLeod Street, Condong NSW 2484 | 16 Jul 2024 |
| Demolition of existing dwelling, new raised dwelling with detached garage and above-ground swimming pool - Tweed Shire Council DA23/0590 | 8336 Tweed Valley Way, Condong NSW 2484 | 21 Nov 2023 |
Planning Applications: Other (6)
| Headline | Place | Date |
|---|---|---|
| Demolition of existing dwelling, new raised dwelling with detached garage and above-ground swimming pool - Tweed Shire Council DA23/0590 | 8336 Tweed Valley Way, Condong NSW 2484 | 21 Nov 2023 |
| Patio - Tweed Shire Council DA22/0516 | 6 Maria Court, Condong NSW 2484 | 08 Aug 2022 |
| Dwelling with attached garage - Tweed Shire Council DA22/0448 | 71 - 73 McLeod Street, Condong NSW 2484 | 13 Jul 2022 |
| Additions to existing cogeneration plant for the purpose of a data centre, switch room, office and storage and transformers - Tweed Shire Council DA22/0071 | 12 Clothiers Creek Road, Condong NSW 2484 | 07 Feb 2022 |
| Carport within front building line - Tweed Shire Council DA20/0829 | 5 Carmen Place, Condong NSW 2484 | 12 Nov 2020 |
LGA Details (1)
| Headline | Place | Datetime |
|---|---|---|
| Local government area | Tweed |
Median House Rental Prices by Street (1)
| Level_0 | Street | Date | Median rent (per week) |
|---|---|---|---|
| 72172 | Mcleod St | 10 Apr 2025 | $970 |
Percent of Renters by Street (8)
| Percent of Renters | Street |
|---|---|
| 0.0% | Carmen Pl |
| 4.8% | Colonial Dr |
| 0.0% | Clothiers Creek Rd |
| 0.0% | Eviron Rd |
| 22.5% | Mcleod St |
Turnover Rate by Street (7)
| Turnover rate | Street | Turnover Label | Turnover Years | Year |
|---|---|---|---|---|
| 89.9% | Mcleod St | high turnover | Every 11.1 years (high turnover) | 2025 |
| 80.0% | Clothiers Creek Rd | average turnover | Every 12.5 years (average turnover) | 2025 |
| 75.0% | Colonial Dr | average turnover | Every 13.3 years (average turnover) | 2025 |
| 141.7% | Tweed Valley Way | very high turnover | Every 7.1 years (very high turnover) | 2025 |
| 50.0% | Carmen Pl | very tightly held | Every 20.0 years (very tightly held) | 2025 |
Median House Sale Prices by Street (100)
| Street | Date | Median sale value |
|---|---|---|
| Colonial Dr | 10 May 2024 | $775,000 |
| Tweed Valley | 10 May 2024 | $1,135,000 |
| Maria Ct | 10 May 2024 | $1,008,000 |
| Mcleod St | 10 May 2024 | $1,268,000 |
| Carmen Pl | 06 Oct 2023 | $1,047,000 |
Recent Rental House Listings (100)
| Address | Rent (per week) | Bedrooms | Bathrooms | Garage spaces | Date | Subdivisible into |
|---|---|---|---|---|---|---|
| 63 Mcleod St | $1,200 | 4 | 3 | 2 | 25 Nov 2024 | 0 |
| 63 Mcleod St | $1,200 | 4 | 3 | 2 | 25 Nov 2024 | 0 |
| 63 Mcleod St | $1,200 | 4 | 3 | 2 | 25 Nov 2024 | 0 |
| 63 Mcleod St | $1,200 | 4 | 3 | 2 | 25 Nov 2024 | 0 |
| 63 Mcleod St | $1,200 | 4 | 3 | 2 | 25 Nov 2024 | 0 |
Recently Sold Units (100)
| Address | Price | Bedrooms | Bathrooms | Garage spaces | Date sold | Sale Type |
|---|---|---|---|---|---|---|
| 38 Mcleod St | $950,000 | 04 Aug 2023 | On Market | |||
| 38 Mcleod St | $950,000 | 04 Aug 2023 | On Market | |||
| 38 Mcleod St | $950,000 | 04 Aug 2023 | On Market | |||
| 38 Mcleod St | $950,000 | 04 Aug 2023 | On Market | |||
| 38 Mcleod St | $950,000 | 04 Aug 2023 | On Market |
Loading entities ..