.png)
Profiles
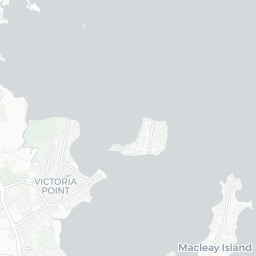
Nearby Suburbs
Real Estate Market: Is Coochiemudlo Island QLD 4184 a Good Suburb to Buy Into?
Housing Market in Coochiemudlo Island

Sources: Property Listings and Microburbs, 2002 - 2023
| Field | Value | VS Brisbane | Trend | |
|---|---|---|---|---|
| Premium | Premium | Premium | ||
| Premium | Premium | Premium | ||
| Premium | Premium | Premium | ||
| $756 | Top 16% |
|
||
| Premium | Premium | Premium |
Housing Supply in Coochiemudlo Island

The higher the supply score the more supply is on the market, both current and future.
Sources: ABS, GEOSPATIAL, Property Listings, PLANNING ALERTS and Microburbs, 2002 - 2023
Sources: ABS, GEOSPATIAL, Property Listings, PLANNING ALERTS and Microburbs, 2002 - 2023
Coochiemudlo Island
45.4%
Coochiemudlo Island
45.4%
Brisbane
30.2%
Brisbane
30.2%
| Field | Value | VS Brisbane | Trend | |
|---|---|---|---|---|
| 396 | Top 10% |
|
||
| 1.4 | Bottom 36% | Data for Jul 2023 | ||
| 43.3 | Top 16% | Data for May 2023 | ||
| Premium | Premium | Premium | ||
| Premium | Premium | Premium | ||
| Premium | Premium | Premium | ||
| Premium | Premium | Premium | ||
| Premium | Premium | Premium | ||
| 5 | Top 24% |
|
Housing Stock Quality in Coochiemudlo Island
The higher the score, the higher the quality of the houses and units.
Sources: ABS, GEOSPATIAL, Property Listings and Microburbs, 2006 - 2023
Sources: ABS, GEOSPATIAL, Property Listings and Microburbs, 2006 - 2023
| Field | Value | VS Brisbane | Trend | |
|---|---|---|---|---|
| 99.0% | Bottom 36% | 0 to Jan 2021 | ||
| 1.9 | Bottom 11% |
|
||
| 66.4% | Top 5% | Data for Jun 2023 |
Development Restrictions in Coochiemudlo Island

The higher the score, the more easily density can be increased.
Sources: GEOSPATIAL, TORREN, ABS and Microburbs, 2011 - 2023
Sources: GEOSPATIAL, TORREN, ABS and Microburbs, 2011 - 2023
Coochiemudlo Island
32.4%
Coochiemudlo Island
32.4%
Brisbane
55.3%
Brisbane
55.3%
| Field | Value | VS Brisbane | Trend | |
|---|---|---|---|---|
| 1.4 sq km | Bottom 14% | Data for Jan 2021 | ||
| 0.0 sq km | Bottom 39% | Data for Jun 2023 | ||
| 1090 sqm per resident | Bottom 46% | Data for Jan 2021 |
Risk in Coochiemudlo Island

The higher the score, the more exposed households are to financial stress.
Sources: ABS, Property Listings, TORREN and Microburbs, 2006 - 2023
Sources: ABS, Property Listings, TORREN and Microburbs, 2006 - 2023
Coochiemudlo Island
43.3
Coochiemudlo Island
43.3
Brisbane
46.5
Brisbane
46.5
| Field | Value | VS Brisbane | Trend | |
|---|---|---|---|---|
| 91.3% | Bottom 47% | 0 to May 2023 | ||
| 8.6% | Top 47% |
|
||
| 60 | Top 6% | Data for Jun 2023 | ||
| $1,540 | Bottom 29% |
|
||
| 56 | Bottom 1% | Data for Jun 2023 | ||
| 57 | Bottom 3% | Data for Jun 2023 | ||
| 33.2% | Top 10% |
|
||
| 27.6% | Bottom 19% |
|
Housing Demand in Coochiemudlo Island
The higher the score, the more demand their is for housing in the area, both current and future.
Sources: ABS, TORREN, Property Listings and Microburbs, 2004 - 2030
Sources: ABS, TORREN, Property Listings and Microburbs, 2004 - 2030
Coochiemudlo Island
61.0%
Coochiemudlo Island
61.0%
Brisbane
85.2%
Brisbane
85.2%
| Field | Value | VS Brisbane | Trend | |
|---|---|---|---|---|
| Premium | Premium | Premium | ||
| 12100 | Top 35% |
|
||
| 98900 | Top 28% |
|
||
| Premium | Premium | Premium | ||
| 186000 | Top 9% |
|
||
| Premium | Premium | Premium | ||
| Premium | Premium | Premium | ||
| Premium | Premium | Premium | ||
| Premium | Premium | Premium |
Unit Market in Coochiemudlo Island
Sources: Property Listings and Microburbs, 2002 - 2023
| Field | Value | VS Brisbane | Trend | |
|---|---|---|---|---|
| Premium | Premium | Premium | ||
| 25.4% | Bottom 0% |
|
Realtors (2)
| Headline | Place | Datetime |
|---|---|---|
| Baywaters Realty | 1 Elizabeth St | |
| LJ. Hooker Coochiemudlo Island | 30 Victoria Parade South |
Accommodation Options (3)
| Headline | Place | Datetime |
|---|---|---|
| Coochie Haven Holiday Units | ||
Percent of Renters by Street (35)
| Percent of Renters | Street |
|---|---|
| 11.1% | Aminya St |
| 9.4% | Capembah St |
| 12.5% | Carefree St |
| 42.9% | Elizabeth St |
| 0.0% | Cypress St |
LGA Details (1)
| Headline | Place | Datetime |
|---|---|---|
| Local government area | Redland |
Recently Sold Houses (100)
| Address | Price | Bedrooms | Bathrooms | Garage spaces | Date sold | Subdivisible into | Sale Type |
|---|---|---|---|---|---|---|---|
| 14 Carefree St | Price Withheld | 4.0 | 3.0 | 1.0 | 17 Jan 2025 | 0 | On Market |
| 36 Shirley St | $300,000 | 0.0 | 0.0 | 0.0 | 02 Dec 2024 | 0 | On Market |
| 39 Phillips St | $648,750 | 2.0 | 1.0 | 2.0 | 18 Nov 2024 | 0 | On Market |
| 19 Tageruba St | $470,000 | 3.0 | 1.0 | 2.0 | 09 Nov 2024 | 0 | On Market |
| 6 Mooroondu St | Price Withheld | 5.0 | 2.0 | 3.0 | 08 Nov 2024 | 0 | On Market |
Median House Rental Prices by Street (5)
| Level_0 | Street | Date | Median rent (per week) |
|---|---|---|---|
| 134993 | James St | 13 Mar 2025 | $562 |
| 135306 | Tageruba St | 13 Mar 2025 | $600 |
| 135083 | Mareela St | 13 Mar 2025 | $502 |
| 71267 | Mooroondu St | 16 Feb 2025 | $425 |
| 79796 | Carefree St | 01 Jan 2025 | $497 |
Turnover Rate by Street (37)
| Turnover rate | Street | Turnover Label | Turnover Years | Year |
|---|---|---|---|---|
| 117.9% | Capembah St | very high turnover | Every 8.5 years (very high turnover) | 2025 |
| 72.0% | Phillips St | average turnover | Every 13.9 years (average turnover) | 2025 |
| 81.1% | James St | average turnover | Every 12.3 years (average turnover) | 2025 |
| 105.0% | Orange Grove St | high turnover | Every 9.5 years (high turnover) | 2025 |
| 171.4% | Aminya St | very high turnover | Every 5.8 years (very high turnover) | 2025 |
Planning Applications: Other (5)
| Headline | Place | Date |
|---|---|---|
| Operational Works for Gate Installation to protect foreshore reserve by restricting unlawful vehicle access - Redland City Council OPW24/0049 | 245 Victoria Parade West Coochiemudlo Island QLD 4184 | 21 May 2024 |
| Building Work for Open-sided Roofed Structure - Redland City Council DBW23/0049 | Doug and Mary Morton Reserve 326-344 Victoria Parade South Coochiemudlo Island QLD 4184 | 20 Dec 2023 |
| Granny Flat - Class 1a and 10a - Redland City Council BX323483 | 9 Eprapah Street, Coochiemudlo Island QLD 4184 | 20 May 2021 |
| Standard Format- 1 into 2 - Redland City Council RAL20/0078 | 5 - 7 Shirley Street, Coochiemudlo Island QLD 4184 | 12 Nov 2020 |
| Partial Re Roofing - Class 1 a - Redland City Council BX321188 | 60 Victoria Parade South, Coochiemudlo Island QLD 4184 | 26 Jul 2020 |
Planning Applications: Dwellings (33)
| Headline | Place | Date |
|---|---|---|
| Dwelling - Redland City Council PD243483 | 14 Marroo Street, Coochiemudlo Island QLD 4184 | 18 Jul 2022 |
| Dwelling - Redland City Council PD243378 | 5 Cypress Street, Coochiemudlo Island QLD 4184 | 16 Jun 2022 |
| Dwelling - Redland City Council PD243357 | 22 Kingfisher Street, Coochiemudlo Island QLD 4184 | 10 Jun 2022 |
| Dwelling - Redland City Council PD243313 | 13 - 15 Erobin Street, Coochiemudlo Island QLD 4184 | 30 May 2022 |
| Dwelling - Redland City Council PD243190 | 12 James Street, Coochiemudlo Island QLD 4184 | 12 Apr 2022 |
Businesses (5)
| Name | Address |
|---|---|
| Baywaters Realty | 1 Elizabeth St, Coochiemudlo Island QLD 4184, Australia |
| LJ. Hooker Coochiemudlo Island | 30, Victoria Parade South |
| LJ. Hooker Coochiemudlo Island | 30, Victoria Parade South |
| LJ. Hooker Coochiemudlo Island | 30, Victoria Parade South |
| LJ. Hooker Coochiemudlo Island | 30, Victoria Parade South |
Median House Sale Prices by Street (100)
| Street | Date | Median sale value |
|---|---|---|
| Aminya St | 10 May 2024 | $677,500 |
| Cypress St | 10 May 2024 | $555,000 |
| Welsby St | 10 May 2024 | $649,500 |
| Tageruba St | 10 May 2024 | $480,000 |
| Dawn St | 10 May 2024 | $480,000 |
Median Unit Sale Prices by Street (1)
| Date | Median sale value | Street |
|---|---|---|
| 10 May 2024 | $295,000 | Aminya St |
Recent Rental Unit Listings (100)
| Address | Rent (per week) | Bedrooms | Bathrooms | Garage spaces | Date |
|---|---|---|---|---|---|
| Unit 2, 54 Tageruba St | $220 | 2.0 | 1.0 | 09 Jan 2020 | |
| Unit 2, 54 Tageruba St | $220 | 2.0 | 1.0 | 09 Jan 2020 | |
| Unit 2, 54 Tageruba St | $220 | 2.0 | 1.0 | 09 Jan 2020 | |
| Unit 2, 54 Tageruba St | $220 | 2.0 | 1.0 | 09 Jan 2020 | |
| Unit 2, 54 Tageruba St | $220 | 2.0 | 1.0 | 09 Jan 2020 |
Recent Rental House Listings (100)
| Address | Rent (per week) | Bedrooms | Bathrooms | Garage spaces | Date | Subdivisible into |
|---|---|---|---|---|---|---|
| 14 James St | $550 | 4 | 2 | 2 | 13 Dec 2024 | 0 |
| 14 James St | $550 | 4 | 2 | 2 | 13 Dec 2024 | 0 |
| 14 James St | $550 | 4 | 2 | 2 | 13 Dec 2024 | 0 |
| 14 James St | $550 | 4 | 2 | 2 | 13 Dec 2024 | 0 |
| 14 James St | $550 | 4 | 2 | 2 | 13 Dec 2024 | 0 |
Recently Sold Units (100)
| Address | Price | Bedrooms | Bathrooms | Garage spaces | Date sold | Sale Type |
|---|---|---|---|---|---|---|
| 36 Shirley St | $300,000 | 0.0 | 0.0 | 0.0 | 02 Dec 2024 | On Market |
| 36 Shirley St | $300,000 | 0.0 | 0.0 | 0.0 | 02 Dec 2024 | On Market |
| 36 Shirley St | $300,000 | 0.0 | 0.0 | 0.0 | 02 Dec 2024 | On Market |
| 36 Shirley St | $300,000 | 0.0 | 0.0 | 0.0 | 02 Dec 2024 | On Market |
| 36 Shirley St | $300,000 | 0.0 | 0.0 | 0.0 | 02 Dec 2024 | On Market |
Loading entities ..