.png)
Profiles
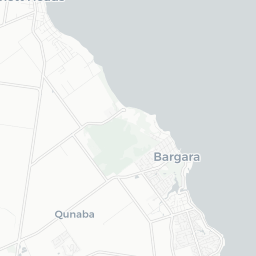
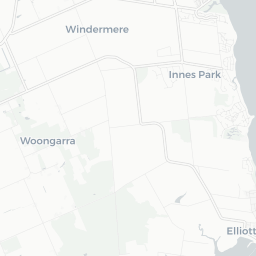
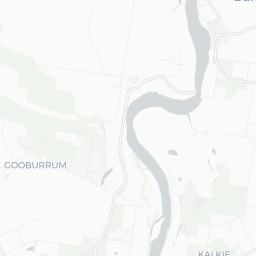
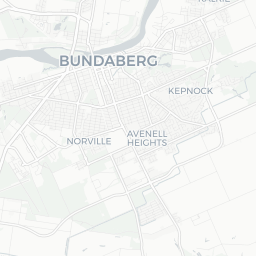
Nearby Suburbs
Real Estate Market: Is Coral Cove QLD 4670 a Good Suburb to Buy Into?
Housing Market in Coral Cove

Sources: Property Listings and Microburbs, 2002 - 2023
| Field | Value | VS Wide Bay | Trend | |
|---|---|---|---|---|
| Premium | Premium | Premium | ||
| Premium | Premium | Premium | ||
| Premium | Premium | Premium | ||
| $589 | Top 48% |
|
||
| Premium | Premium | Premium |
Housing Supply in Coral Cove

The higher the supply score the more supply is on the market, both current and future.
Sources: ABS, GEOSPATIAL, Property Listings, PLANNING ALERTS and Microburbs, 2002 - 2023
Sources: ABS, GEOSPATIAL, Property Listings, PLANNING ALERTS and Microburbs, 2002 - 2023
Coral Cove
48.8%
Coral Cove
48.8%
Wide Bay
40.0%
Wide Bay
40.0%
| Field | Value | VS Wide Bay | Trend | |
|---|---|---|---|---|
| 0 | Bottom 38% | Data for Jun 2025 | ||
| 0.0 | Bottom 10% | Data for Jul 2023 | ||
| 20.8 | Top 23% | Data for May 2023 | ||
| Premium | Premium | Premium | ||
| Premium | Premium | Premium | ||
| Premium | Premium | Premium | ||
| 17 lots | Top 19% | Data for Jan 2022 | ||
| Premium | Premium | Premium | ||
| Premium | Premium | Premium | ||
| 5 | Top 14% |
|
Housing Stock Quality in Coral Cove
The higher the score, the higher the quality of the houses and units.
Sources: ABS, GEOSPATIAL, Property Listings and Microburbs, 2006 - 2023
Sources: ABS, GEOSPATIAL, Property Listings and Microburbs, 2006 - 2023
| Field | Value | VS Wide Bay | Trend | |
|---|---|---|---|---|
| 98.1% | Bottom 34% |
|
||
| 2.7 | Top 30% |
|
||
| 18.5% | Top 13% | Data for Jun 2023 |
Development Restrictions in Coral Cove

The higher the score, the more easily density can be increased.
Sources: GEOSPATIAL, TORREN, ABS and Microburbs, 2011 - 2023
Sources: GEOSPATIAL, TORREN, ABS and Microburbs, 2011 - 2023
Coral Cove
33.8%
Coral Cove
33.8%
Wide Bay
35.5%
Wide Bay
35.5%
| Field | Value | VS Wide Bay | Trend | |
|---|---|---|---|---|
| 11.0 sq km | Top 44% | Data for Jan 2021 | ||
| 0.0 sq km | Bottom 39% | Data for Jun 2023 | ||
| 938 sqm per resident | Bottom 43% | Data for Jan 2021 |
Risk in Coral Cove

The higher the score, the more exposed households are to financial stress.
Sources: ABS, Property Listings, TORREN and Microburbs, 2006 - 2023
Sources: ABS, Property Listings, TORREN and Microburbs, 2006 - 2023
Coral Cove
46.0
Coral Cove
46.0
Wide Bay
44.0
Wide Bay
44.0
| Field | Value | VS Wide Bay | Trend | |
|---|---|---|---|---|
| 85.8% | Bottom 29% |
|
||
| 14.2% | Top 29% |
|
||
| 36 | Top 40% | Data for Jun 2023 | ||
| $2,190 | Top 35% |
|
||
| 74 | Bottom 26% | Data for Jun 2023 | ||
| 78 | Top 38% | Data for Jun 2023 | ||
| 23.5% | Top 43% |
|
||
| 42.1% | Top 40% |
|
Housing Demand in Coral Cove
The higher the score, the more demand their is for housing in the area, both current and future.
Sources: ABS, TORREN, Property Listings and Microburbs, 1975 - 2030
Sources: ABS, TORREN, Property Listings and Microburbs, 1975 - 2030
Coral Cove
56.0%
Coral Cove
56.0%
Wide Bay
53.8%
Wide Bay
53.8%
| Field | Value | VS Wide Bay | Trend | |
|---|---|---|---|---|
| Premium | Premium | Premium | ||
| Premium | Premium | Premium | ||
| 25600 | Top 8% |
|
||
| 98500 | Top 29% |
|
||
| Premium | Premium | Premium | ||
| 103000 | Top 16% |
|
||
| Premium | Premium | Premium | ||
| Premium | Premium | Premium | ||
| Premium | Premium | Premium | ||
| Premium | Premium | Premium |
Unit Market in Coral Cove
Sources: Property Listings and Microburbs, 2002 - 2023
| Field | Value | VS Wide Bay | Trend | |
|---|---|---|---|---|
| Premium | Premium | Premium | ||
| $411 | Bottom 27% |
|
||
| Premium | Premium | Premium | ||
| 57.1% | Bottom 10% |
|
LGA Details (1)
| Headline | Place | Datetime |
|---|---|---|
| Local government area | Bundaberg |
Median House Rental Prices by Street (7)
| Street | Date | Median rent (per week) |
|---|---|---|
| Barolin Esp | 06 Mar 2025 | $750 |
| Bisdee St | 06 Mar 2025 | $650 |
| Robert John Cct | 06 Mar 2025 | $717 |
| Toppers Dr | 06 Mar 2025 | $597 |
| Marian St | 06 Mar 2025 | $680 |
Median House Sale Prices by Street (100)
| Street | Date | Median sale value |
|---|---|---|
| Chantelle Cct | 10 May 2024 | $727,500 |
| Barolin Esp | 10 May 2024 | $795,000 |
| Bisdee St | 10 May 2024 | $839,000 |
| Betty Cl | 10 May 2024 | $815,000 |
| Back Hill Dr | 10 May 2024 | $785,000 |
Turnover Rate by Street (36)
| Turnover rate | Street | Turnover Label | Turnover Years | Year |
|---|---|---|---|---|
| 116.0% | Brandon Ct | very high turnover | Every 8.6 years (very high turnover) | 2025 |
| 100.0% | Mokera St | high turnover | Every 10.0 years (high turnover) | 2025 |
| 116.1% | Bisdee St | very high turnover | Every 8.6 years (very high turnover) | 2025 |
| 100.0% | Spyglass Hill Ct | high turnover | Every 10.0 years (high turnover) | 2025 |
| 101.3% | Barolin Esp | high turnover | Every 9.9 years (high turnover) | 2025 |
Percent of Renters by Street (36)
| Percent of Renters | Street |
|---|---|
| 0.0% | Admiralty Pl |
| 0.0% | Arthur Brown Ct |
| 0.0% | Arunda St |
| 12.1% | Back Hill Dr |
| 17.0% | Barolin Esp |
Planning Applications: Other (5)
| Headline | Place | Date |
|---|---|---|
| Design and Siting (Patio) - Bundaberg Regional Council 532.2022.1994.1 | 16 Mokera St, Coral Cove 4670 QLD | 08 Jul 2022 |
| Design and Siting (Patio) - Bundaberg Regional Council 532.2022.1978.1 | 8 Bisdee St, Coral Cove 4670 QLD | 30 Jun 2022 |
| Extension Application (Stage 32-34) - Bundaberg Regional Council 527.2021.70.1 | Barolin Esp, Coral Cove 4670 QLD | 24 Feb 2021 |
| Reconfiguring a Lot (1 Lot into 26 Lots) - Bundaberg Regional Council 527.2021.69.1 | Barolin Esp, Coral Cove 4670 QLD | 24 Feb 2021 |
| Amenity & Aesthetics (Carport) - Bundaberg Regional Council 532.2021.1218.1 | 2 Raewood Cl, Coral Cove 4670 QLD | 29 Jan 2021 |
Planning Applications: Dwellings (4)
| Headline | Place | Date |
|---|---|---|
| Design and Siting (Dwelling) - Bundaberg Regional Council 532.2022.1852.1 | 15 Marian St, Coral Cove 4670 QLD | 30 Mar 2022 |
| Dual Occupancy - Bundaberg Regional Council 522.2021.293.1 | 1 Brandon Ct, Coral Cove 4670 QLD | 10 Dec 2021 |
| Amenity and Aesthetics (Dwelling) - Bundaberg Regional Council 532.2020.1164.1 | 23 Mokera St, Coral Cove 4670 QLD | 26 Nov 2020 |
| Design & Siting (Dwelling) - Bundaberg Regional Council 532.2020.946.1 | 10 Betty Cl, Coral Cove 4670 QLD | 02 Jul 2020 |
Median Unit Sale Prices by Street (87)
| Date | Median sale value | Street |
|---|---|---|
| 10 May 2024 | $422,500 | Pebble Beach Dr |
| 25 Apr 2024 | $495,000 | Barolin Esp |
| 06 Oct 2023 | $1,379,000 | Back Hill Dr |
| 31 May 2024 | 206000.0 | Back Hill Dr |
| 31 May 2024 | 167400.0 | Chantelle Cct |
Recently Sold Houses (100)
| Address | Price | Bedrooms | Bathrooms | Garage spaces | Date sold | Subdivisible into | Sale Type |
|---|---|---|---|---|---|---|---|
| Villa 26, 1 Pebble Beach Dr | $340,000 | 1.0 | 1.0 | 1.0 | 27 Feb 2025 | 0 | On Market |
| 8 Robert John Circuit | Price Withheld | 4.0 | 2.0 | 2.0 | 27 Feb 2025 | 0 | On Market |
| 73 Barolin Esp | $395,000 | 0.0 | 0.0 | 0.0 | 11 Feb 2025 | 0 | On Market |
| 222 Barolin Esp | $890,000 | 4.0 | 2.0 | 2.0 | 30 Jan 2025 | 0 | On Market |
| 10 Mokera St | $705,000 | 3.0 | 1.0 | 2.0 | 22 Jan 2025 | 0 | On Market |
Businesses (5)
| Name | Address |
|---|---|
| GeoRadar Australia Pty Ltd | 3 Mokera St, Coral Cove QLD 4670, Australia |
| New Wave Data and Electrical Services | Barolin Esplanade, Coral Cove QLD 4670, Australia |
| Zane Dick Electrical & Air Conditioning | 46 Barolin Esplanade, Coral Cove QLD 4670, Australia |
| Sambrett Homes | 1 Raewood Cl, Coral Cove QLD 4670, Australia |
| Breeze Homes Bundy Pty Ltd | 166, Barolin Esplanade |
Recent Rental Unit Listings (100)
| Address | Rent (per week) | Bedrooms | Bathrooms | Garage spaces | Date |
|---|---|---|---|---|---|
| Villa 22, 1 Pebble Beach Dr | $450 | 1.0 | 1.0 | 1.0 | 16 Jul 2024 |
| Villa 22, 1 Pebble Beach Dr | $450 | 1.0 | 1.0 | 1.0 | 16 Jul 2024 |
| Villa 22, 1 Pebble Beach Dr | $450 | 1.0 | 1.0 | 1.0 | 16 Jul 2024 |
| Villa 22, 1 Pebble Beach Dr | $450 | 1.0 | 1.0 | 1.0 | 16 Jul 2024 |
| Villa 22, 1 Pebble Beach Dr | $450 | 1.0 | 1.0 | 1.0 | 16 Jul 2024 |
Recent Rental House Listings (100)
| Address | Rent (per week) | Bedrooms | Bathrooms | Garage spaces | Date | Subdivisible into |
|---|---|---|---|---|---|---|
| 10 Mokera St | $695 | 3 | 1 | 2 | 07 Feb 2025 | 0 |
| 10 Mokera St | $695 | 3 | 1 | 2 | 07 Feb 2025 | 0 |
| 10 Mokera St | $695 | 3 | 1 | 2 | 07 Feb 2025 | 0 |
| 3 Marian St | $650 | 2 | 1 | 2 | 14 Jan 2025 | 0 |
| 3 Marian St | $650 | 2 | 1 | 2 | 14 Jan 2025 | 0 |
Recently Sold Units (100)
| Address | Price | Bedrooms | Bathrooms | Garage spaces | Date sold | Sale Type |
|---|---|---|---|---|---|---|
| Villa 32, 1 Pebble Beach Dr | Price Withheld | 1.0 | 1.0 | 1.0 | 17 Feb 2025 | On Market |
| Villa 32, 1 Pebble Beach Dr | Price Withheld | 1.0 | 1.0 | 1.0 | 17 Feb 2025 | On Market |
| Villa 32, 1 Pebble Beach Dr | Price Withheld | 1.0 | 1.0 | 1.0 | 17 Feb 2025 | On Market |
| 73 Barolin Esp | $395,000 | 0.0 | 0.0 | 0.0 | 11 Feb 2025 | On Market |
| 3 Bobby Pl | $310,000 | 0.0 | 0.0 | 0.0 | 02 Oct 2024 | On Market |
Loading entities ..