.png)
Profiles
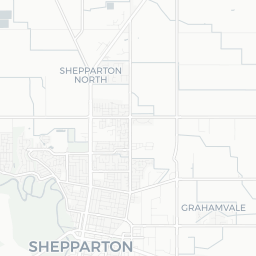
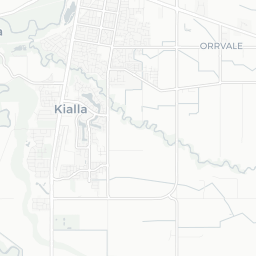
Nearby Suburbs
Real Estate Market: Is Cosgrove South VIC 3631 a Good Suburb to Buy Into?
Housing Market in Cosgrove South

Sources: Property Listings and Microburbs, 2002 - 2023
| Field | Value | VS Shepparton | Trend | |
|---|---|---|---|---|
| Premium | Premium | Premium | ||
| Premium | Premium | Premium | ||
| Premium | Premium | Premium | ||
| $501 | Bottom 24% |
|
||
| Premium | Premium | Premium |
Housing Supply in Cosgrove South

The higher the supply score the more supply is on the market, both current and future.
Sources: ABS, GEOSPATIAL, Property Listings, PLANNING ALERTS and Microburbs, 2002 - 2023
Sources: ABS, GEOSPATIAL, Property Listings, PLANNING ALERTS and Microburbs, 2002 - 2023
Cosgrove South
61.8%
Cosgrove South
61.8%
Shepparton
38.4%
Shepparton
38.4%
| Field | Value | VS Shepparton | Trend | |
|---|---|---|---|---|
| 0 | Bottom 38% | Data for Jun 2025 | ||
| 7.5 | Top 21% | Data for Jul 2023 | ||
| Premium | Premium | Premium | ||
| Premium | Premium | Premium | ||
| Premium | Premium | Premium | ||
| Premium | Premium | Premium | ||
| Premium | Premium | Premium | ||
| 0 | Bottom 24% |
|
Housing Stock Quality in Cosgrove South
The higher the score, the higher the quality of the houses and units.
Sources: ABS, GEOSPATIAL, Property Listings and Microburbs, 2006 - 2023
Sources: ABS, GEOSPATIAL, Property Listings and Microburbs, 2006 - 2023
| Field | Value | VS Shepparton | Trend | |
|---|---|---|---|---|
| 100.0% | Top 31% | Data for Jan 2021 | ||
| 2.0 | Bottom 15% |
|
||
| 0.0% | Bottom 37% | Data for Jun 2023 |
Development Restrictions in Cosgrove South

The higher the score, the more easily density can be increased.
Sources: GEOSPATIAL, TORREN and Microburbs, 2011 - 2023
Sources: GEOSPATIAL, TORREN and Microburbs, 2011 - 2023
Cosgrove South
21.1%
Cosgrove South
21.1%
Shepparton
26.6%
Shepparton
26.6%
| Field | Value | VS Shepparton | Trend | |
|---|---|---|---|---|
| 0.0 sq km | Top 45% | Data for Jun 2023 |
Risk in Cosgrove South

The higher the score, the more exposed households are to financial stress.
Sources: ABS, Property Listings, TORREN and Microburbs, 2006 - 2023
Sources: ABS, Property Listings, TORREN and Microburbs, 2006 - 2023
Cosgrove South
37.8
Cosgrove South
37.8
Shepparton
34.7
Shepparton
34.7
| Field | Value | VS Shepparton | Trend | |
|---|---|---|---|---|
| 100.0% | Top 11% | Data for May 2023 | ||
| 0.0% | Bottom 11% | Data for May 2023 | ||
| 25 | Bottom 23% | Data for Jun 2023 | ||
| $1,260 | Bottom 18% |
|
||
| 84 | Top 18% | Data for Jun 2023 | ||
| 82 | Top 14% | Data for Jun 2023 | ||
| 26.6% | Top 27% |
|
||
| 35.6% | Bottom 41% | Data for May 2023 |
Housing Demand in Cosgrove South
The higher the score, the more demand their is for housing in the area, both current and future.
Sources: ABS, TORREN, Property Listings and Microburbs, 2006 - 2030
Sources: ABS, TORREN, Property Listings and Microburbs, 2006 - 2030
Cosgrove South
50.5%
Cosgrove South
50.5%
Shepparton
50.6%
Shepparton
50.6%
| Field | Value | VS Shepparton | Trend | |
|---|---|---|---|---|
| Premium | Premium | Premium | ||
| Premium | Premium | Premium | ||
| 4170 | Bottom 11% |
|
||
| 68900 | Top 45% |
|
||
| Premium | Premium | Premium | ||
| 72500 | Top 20% |
|
||
| Premium | Premium | Premium | ||
| Premium | Premium | Premium | ||
| Premium | Premium | Premium |
Unit Market in Cosgrove South
Sources: Property Listings and Microburbs, 2002 - 2023
| Field | Value | VS Shepparton | Trend | |
|---|---|---|---|---|
| Premium | Premium | Premium | ||
| $388 | Bottom 13% |
|
||
| Premium | Premium | Premium | ||
| 89.5% | Top 19% |
|
Planning Applications: Other (4)
| Headline | Place | Date |
|---|---|---|
| Use of land to recieve / accept and crush concrete within the existing quarry - Greater Shepparton City Council 2016-389/A | 875 Dookie-Gowangardie Road Cosgrove South VIC 3631 | 08 Feb 2025 |
| Buildings and works in the Floodway Overlay for a roof canopy - Greater Shepparton City Council 2022-88 | 1910 Midland Highway Cosgrove South VIC 3631 | 21 Mar 2022 |
| Buildings and works in the Farming Zone, Bushfire Management Overlay and Floodway Overlay - Greater Shepparton City Council 2021-27/A | 1910 Midland Highway Cosgrove South VIC 3631 | 11 Nov 2021 |
| Buildings and works in the Farming Zone, Bushfire Management Overlay and Floodway Overlay - Greater Shepparton City Council 2021-27 | 1910 Midland Highway Cosgrove South VIC 3631 | 26 Jan 2021 |
Planning Applications: Dwellings (2)
| Headline | Place | Date |
|---|---|---|
| We are seeking an amendment to our planning permit 2016-389 to recycle concrete and other construction waste eg; bricks and tiles at our Cosgrove quarry site. - Greater Shepparton City Council 2025-17 | 875 Dookie-Gowangardie Road Cosgrove South VIC 3631 | 31 Jan 2025 |
| Permit for a dwelling - Greater Shepparton City Council 2021-113 | 2570 Midland Highway Cosgrove South VIC 3631 | 22 Mar 2021 |
LGA Details (1)
| Headline | Place | Datetime |
|---|---|---|
| Local government area | Greater Shepparton |
Turnover Rate by Street (9)
| Turnover rate | Street | Turnover Label | Turnover Years | Year |
|---|---|---|---|---|
| 250.0% | Midland Deviation | very high turnover | Every 4.0 years (very high turnover) | 2025 |
| 107.7% | Midland Hwy | very high turnover | Every 9.3 years (very high turnover) | 2025 |
| 100.0% | Shepparton-Dookie College Rd | high turnover | Every 10.0 years (high turnover) | 2025 |
| 100.0% | Dookie-Gowangardie Rd | high turnover | Every 10.0 years (high turnover) | 2025 |
| 50.0% | Hosie Rd | very tightly held | Every 20.0 years (very tightly held) | 2025 |
Percent of Renters by Street (11)
| Percent of Renters | Street |
|---|---|
| 0.0% | Berry Rd |
| 0.0% | Bridge Rd |
| 0.0% | Dookie-Gowangardie Rd |
| 0.0% | Exton Rd |
| 0.0% | Hosie Rd |
Recently Sold Houses (4)
| Address | Price | Bedrooms | Bathrooms | Garage spaces | Date sold | Subdivisible into | Sale Type |
|---|---|---|---|---|---|---|---|
| 1980 Midland Hwy | $415,000 | 3.0 | 1.0 | 2.0 | 03 Jun 2021 | 0 | On Market |
| 1980 Midland Hwy | $415,000 | 3.0 | 1.0 | 2.0 | 03 Jun 2021 | 0 | On Market |
| 2500 Midland Hwy | Price Withheld | 5.0 | 3.0 | 3.0 | 16 Dec 2020 | 0 | On Market |
| 2195 Midland Hwy | $395,000 | 1.0 | 01 Aug 2012 | 0 | On Market |
Recent Rental House Listings (100)
| Address | Rent (per week) | Bedrooms | Bathrooms | Garage spaces | Date | Subdivisible into |
|---|---|---|---|---|---|---|
| 640 Shepparton-dookie College Rd | $500 | 3 | 2 | 4 | 14 Nov 2023 | 0 |
| 640 Shepparton-dookie College Rd | $500 | 3 | 2 | 4 | 14 Nov 2023 | 0 |
| 640 Shepparton-dookie College Rd | $500 | 3 | 2 | 4 | 14 Nov 2023 | 0 |
| 640 Shepparton-dookie College Rd | $500 | 3 | 2 | 4 | 14 Nov 2023 | 0 |
| 640 Shepparton-dookie College Rd | $500 | 3 | 2 | 4 | 14 Nov 2023 | 0 |
Recently Sold Units (100)
| Address | Price | Bedrooms | Bathrooms | Garage spaces | Date sold | Sale Type |
|---|---|---|---|---|---|---|
| 2695 Midland Hwy | Price Withheld | 4.0 | 1.0 | 0.0 | 11 Nov 2022 | On Market |
| 2695 Midland Hwy | Price Withheld | 4.0 | 1.0 | 0.0 | 11 Nov 2022 | On Market |
| 2695 Midland Hwy | Price Withheld | 4.0 | 1.0 | 0.0 | 11 Nov 2022 | On Market |
| 2695 Midland Hwy | $5,225,000 | 4.0 | 1.0 | 11 Nov 2022 | On Market | |
| 2695 Midland Hwy | Price Withheld | 4.0 | 1.0 | 0.0 | 11 Nov 2022 | On Market |
Loading entities ..