.png)
Profiles
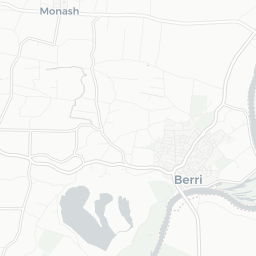
Nearby Suburbs
Real Estate Market: Is Crescent SA 5341 a Good Suburb to Buy Into?
Housing Market in Crescent

Sources: Property Listings and Microburbs, 2006 - 2023
| Field | Value | VS Regional SA | Trend | |
|---|---|---|---|---|
| Premium | Premium | Premium | ||
| Premium | Premium | Premium | ||
| Premium | Premium | Premium |
Housing Supply in Crescent

The higher the supply score the more supply is on the market, both current and future.
Sources: ABS, GEOSPATIAL, Property Listings, PLANNING ALERTS and Microburbs, 2002 - 2023
Sources: ABS, GEOSPATIAL, Property Listings, PLANNING ALERTS and Microburbs, 2002 - 2023
Crescent
50.4%
Crescent
50.4%
Regional SA
46.5%
Regional SA
46.5%
| Field | Value | VS Regional SA | Trend | |
|---|---|---|---|---|
| 0 | Bottom 38% |
|
||
| 0.0 | Bottom 10% | Data for Jul 2023 | ||
| Premium | Premium | Premium | ||
| Premium | Premium | Premium | ||
| Premium | Premium | Premium |
Housing Stock Quality in Crescent
The higher the score, the higher the quality of the houses and units.
Sources: ABS, GEOSPATIAL and Microburbs, 2006 - 2023
Sources: ABS, GEOSPATIAL and Microburbs, 2006 - 2023
| Field | Value | VS Regional SA | Trend | |
|---|---|---|---|---|
| 100.0% | Top 31% | Data for Jan 2021 | ||
| 2.5 | Top 48% |
|
||
| 0.0% | Bottom 37% | Data for Jun 2023 |
Development Restrictions in Crescent

The higher the score, the more easily density can be increased.
Sources: GEOSPATIAL, TORREN and Microburbs, 2011 - 2023
Sources: GEOSPATIAL, TORREN and Microburbs, 2011 - 2023
Crescent
23.7%
Crescent
23.7%
Regional SA
27.5%
Regional SA
27.5%
| Field | Value | VS Regional SA | Trend |
|---|
Risk in Crescent

The higher the score, the more exposed households are to financial stress.
Sources: ABS, Property Listings, TORREN and Microburbs, 2006 - 2023
Sources: ABS, Property Listings, TORREN and Microburbs, 2006 - 2023
Crescent
31.8
Crescent
31.8
Regional SA
33.7
Regional SA
33.7
| Field | Value | VS Regional SA | Trend | |
|---|---|---|---|---|
| 100.0% | Top 11% | Data for May 2023 | ||
| 0.0% | Bottom 11% | Data for May 2023 | ||
| 26 | Bottom 28% | Data for Jun 2023 | ||
| $426 | Bottom 2% |
|
||
| 82 | Top 27% | Data for Jun 2023 | ||
| 79 | Top 31% | Data for Jun 2023 | ||
| 28.2% | Top 21% |
|
||
| 44.2% | Top 34% |
|
Housing Demand in Crescent
The higher the score, the more demand their is for housing in the area, both current and future.
Sources: ABS, TORREN, Property Listings and Microburbs, 2006 - 2030
Sources: ABS, TORREN, Property Listings and Microburbs, 2006 - 2030
Crescent
26.5%
Crescent
26.5%
Regional SA
37.0%
Regional SA
37.0%
| Field | Value | VS Regional SA | Trend | |
|---|---|---|---|---|
| Premium | Premium | Premium | ||
| 5490 | Bottom 20% |
|
||
| 73800 | Top 42% |
|
||
| Premium | Premium | Premium | ||
| 9980 | Bottom 43% |
|
||
| Premium | Premium | Premium | ||
| Premium | Premium | Premium |
LGA Details (1)
| Headline | Place | Datetime |
|---|---|---|
| Local government area | Renmark Paringa |
Turnover Rate by Street (9)
| Turnover rate | Street | Turnover Label | Turnover Years | Year |
|---|---|---|---|---|
| 76.9% | Twentythird St | average turnover | Every 13.0 years (average turnover) | 2025 |
| 33.3% | Nelwart St | very tightly held | Every 30.0 years (very tightly held) | 2025 |
| 28.6% | Plushsbend Rd | very tightly held | Every 35.0 years (very tightly held) | 2025 |
| 57.1% | Townsend St | quite tightly held | Every 17.5 years (quite tightly held) | 2025 |
| 80.0% | Twentysecond St | average turnover | Every 12.5 years (average turnover) | 2025 |
Percent of Renters by Street (9)
| Percent of Renters | Street |
|---|---|
| 0.0% | Crescent St |
| 0.0% | Moorna St |
| 0.0% | Nelwart St |
| 0.0% | Plushsbend Rd |
| 0.0% | Tintree St |
Recently Sold Houses (16)
| Address | Price | Bedrooms | Bathrooms | Garage spaces | Date sold | Subdivisible into | Sale Type |
|---|---|---|---|---|---|---|---|
| 32 Moorna St | $540,000 | 4.0 | 2.0 | 4.0 | 06 Jun 2024 | 0 | On Market |
| 40 Twentyfourth St | $360,000 | 3.0 | 1.0 | 2.0 | 30 May 2024 | 0 | On Market |
| 32 Moorna St | $540,000 | 4.0 | 2.0 | 4.0 | 20 May 2024 | 0 | On Market |
| 40 Twentyfourth St | $360,000 | 3.0 | 1.0 | 2.0 | 29 Apr 2024 | 0 | On Market |
| 78 Twentysecond St | Price Withheld | 4.0 | 2.0 | 4.0 | 18 May 2023 | 0 | On Market |
Planning Applications: Other (1)
| Headline | Place | Date |
|---|---|---|
| Agricultural building - South Australia Planning Portal 22028475 | 112 Townsend St Crescent SA 5341 | 31 Aug 2022 |
Planning Applications: Dwellings (1)
| Headline | Place | Date |
|---|---|---|
| Demolition of existing dwelling and construction of new dwelling. - South Australia Planning Portal 21023836 | 29 Townsend St Crescent SA 5341 | 29 Sep 2021 |
Median House Sale Prices by Street (100)
| Street | Date | Median sale value |
|---|---|---|
| Moorna St | 31 May 2024 | 397000.0 |
| Townsend St | 31 May 2024 | 456400.0 |
| Twentyfourth St | 31 May 2024 | 477600.0 |
| Twentysecond St | 31 May 2024 | 415600.0 |
| Twentythird St | 31 May 2024 | 786800.0 |
Recently Sold Units (100)
| Address | Price | Bedrooms | Bathrooms | Garage spaces | Date sold | Sale Type |
|---|---|---|---|---|---|---|
| 47 Twentysecond St | $295,000 | 4.0 | 1.0 | 2.0 | 07 Apr 2022 | On Market |
| 47 Twentysecond St | $295,000 | 4.0 | 1.0 | 2.0 | 07 Apr 2022 | On Market |
| 47 Twentysecond St | $295,000 | 4.0 | 1.0 | 2.0 | 07 Apr 2022 | On Market |
| 47 Twentysecond St | $295,000 | 4.0 | 1.0 | 2.0 | 07 Apr 2022 | On Market |
| 47 Twentysecond St | $295,000 | 4.0 | 1.0 | 2.0 | 07 Apr 2022 | On Market |
Loading entities ..