.png)
Profiles
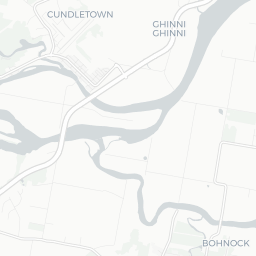
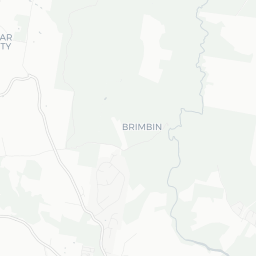
Nearby Suburbs
Real Estate Market: Is Croki NSW 2430 a Good Suburb to Buy Into?
Housing Market in Croki

Sources: Property Listings, TORREN and Microburbs, 2002 - 2023
| Field | Value | VS Mid North Coast NSW | Trend | |
|---|---|---|---|---|
| Premium | Premium | Premium | ||
| Premium | Premium | Premium | ||
| Premium | Premium | Premium | ||
| $554 | Bottom 38% |
|
||
| Premium | Premium | Premium |
Housing Supply in Croki

The higher the supply score the more supply is on the market, both current and future.
Sources: ABS, GEOSPATIAL, Property Listings, PLANNING ALERTS, BASIX and Microburbs, 2002 - 2031
Sources: ABS, GEOSPATIAL, Property Listings, PLANNING ALERTS, BASIX and Microburbs, 2002 - 2031
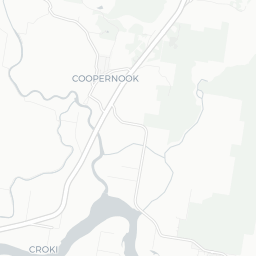
Croki
41.9%
Croki
41.9%
Mid North Coast NSW
41.1%
Mid North Coast NSW
41.1%
| Field | Value | VS Mid North Coast NSW | Trend | |
|---|---|---|---|---|
| 0 | Bottom 38% | Data for Jun 2025 | ||
| 11.4 | Top 14% | Data for Jul 2023 | ||
| Premium | Premium | Premium | ||
| Premium | Premium | Premium | ||
| 2 | Bottom 14% | Data for Dec 2020 | ||
| Premium | Premium | Premium | ||
| Premium | Premium | Premium | ||
| Premium | Premium | Premium | ||
| 0 | Bottom 24% | Data for Mar 2025 |
Housing Stock Quality in Croki
The higher the score, the higher the quality of the houses and units.
Sources: ABS, GEOSPATIAL, Property Listings, BASIX and Microburbs, 2006 - 2023
Sources: ABS, GEOSPATIAL, Property Listings, BASIX and Microburbs, 2006 - 2023
| Field | Value | VS Mid North Coast NSW | Trend | |
|---|---|---|---|---|
| 100.0% | Top 31% | Data for Jan 2021 | ||
| 2.1 | Bottom 20% |
|
||
| 0.0% | Bottom 37% | Data for Jun 2023 |
Development Restrictions in Croki

The higher the score, the more easily density can be increased.
Sources: GEOSPATIAL, TORREN, ABS and Microburbs, 2011 - 2023
Sources: GEOSPATIAL, TORREN, ABS and Microburbs, 2011 - 2023
Croki
17.7%
Croki
17.7%
Mid North Coast NSW
24.0%
Mid North Coast NSW
24.0%
| Field | Value | VS Mid North Coast NSW | Trend | |
|---|---|---|---|---|
| 1.4 sq km | Bottom 14% | Data for Jan 2021 | ||
| 0.0% | Bottom 31% | Data for Jun 2023 | ||
| 8 | Top 18% | Data for Jun 2023 | ||
| 27400 sqm per resident | Top 8% | Data for Jan 2021 |
Risk in Croki

The higher the score, the more exposed households are to financial stress.
Sources: ABS, Property Listings, TORREN and Microburbs, 2006 - 2023
Sources: ABS, Property Listings, TORREN and Microburbs, 2006 - 2023
Croki
72.5%
Croki
72.5%
Mid North Coast NSW
70.3%
Mid North Coast NSW
70.3%
| Field | Value | VS Mid North Coast NSW | Trend | |
|---|---|---|---|---|
| 40 | Top 29% | Data for Jun 2023 | ||
| 74 | Bottom 27% | Data for Jun 2023 | ||
| 69 | Bottom 17% | Data for Jun 2023 | ||
| 21.9% | Bottom 48% |
|
Housing Demand in Croki
The higher the score, the more demand their is for housing in the area, both current and future.
Sources: ABS, TORREN, Property Listings and Microburbs, 2006 - 2030
Sources: ABS, TORREN, Property Listings and Microburbs, 2006 - 2030
Croki
60.3%
Croki
60.3%
Mid North Coast NSW
60.8%
Mid North Coast NSW
60.8%
| Field | Value | VS Mid North Coast NSW | Trend | |
|---|---|---|---|---|
| Premium | Premium | Premium | ||
| 15300 | Top 34% |
|
||
| 58400 | Bottom 43% |
|
||
| Premium | Premium | Premium | ||
| 101000 | Top 17% |
|
||
| Premium | Premium | Premium | ||
| Premium | Premium | Premium | ||
| Premium | Premium | Premium |
Unit Market in Croki
Sources: Property Listings and Microburbs, 2002 - 2023
| Field | Value | VS Mid North Coast NSW | Trend | |
|---|---|---|---|---|
| Premium | Premium | Premium | ||
| 100.0% | Top 12% |
|
Turnover Rate by Street (5)
| Turnover rate | Street | Turnover Label | Turnover Years | Year |
|---|---|---|---|---|
| 66.7% | Ferry Rd | quite tightly held | Every 15.0 years (quite tightly held) | 2025 |
| 57.1% | Reid St | quite tightly held | Every 17.5 years (quite tightly held) | 2025 |
| 200.0% | Young St | very high turnover | Every 5.0 years (very high turnover) | 2025 |
| 60.0% | Barton St | quite tightly held | Every 16.7 years (quite tightly held) | 2025 |
| 100.0% | Lyne St | high turnover | Every 10.0 years (high turnover) | 2025 |
LGA Details (1)
| Headline | Place | Datetime |
|---|---|---|
| Local government area | Mid-Coast |
Planning Applications: Dwellings (4)
| Headline | Place | Date |
|---|---|---|
| Construction Certificate Private Certifier Issue -Two Storey Dwelling - Mid-Coast Council CC2024/0279 | 23 Reid Street Croki NSW 2430 | 04 May 2024 |
| Construction Certificate Private Certifier Issue - Jetty - Mid-Coast Council CC2024/0137 | 9 Reid Street Croki NSW 2430 | 12 Mar 2024 |
| Demolition of existing dwelling & Shed, Construct New 2 Storey Dwelling, shed & carport - Mid-Coast Council DA2023/0088 | 75 Barton Street Croki NSW 2430 | 23 Feb 2023 |
| Construction Certificates - Construction Certificate Private Certifier Issue - Two Storey Dwelling - Mid-Coast Council CC2022/0424 | 7 Reid Street Croki NSW 2430 | 01 Jun 2022 |
Planning Applications: Other (1)
| Headline | Place | Date |
|---|---|---|
| Demolition of existing dwelling & Shed, Construct New 2 Storey Dwelling, shed & carport - Mid-Coast Council DA2023/0088 | 75 Barton Street Croki NSW 2430 | 23 Feb 2023 |
Percent of Renters by Street (5)
| Percent of Renters | Street |
|---|---|
| 56.4% | Barton St |
| 0.0% | Lyne St |
| 0.0% | Reid St |
| 0.0% | Young St |
| 0.0% | Ferry Rd |
Recently Sold Houses (15)
| Address | Price | Bedrooms | Bathrooms | Garage spaces | Date sold | Subdivisible into | Sale Type |
|---|---|---|---|---|---|---|---|
| 7 Ferry Rd | $590,000 | 3.0 | 2.0 | 2.0 | 25 Sep 2024 | 0 | On Market |
| 7 Ferry Rd | Price Withheld | 3.0 | 2.0 | 2.0 | 25 Sep 2024 | 0 | On Market |
| 10 Young St | $490,000 | 2.0 | 1.0 | 2.0 | 01 Feb 2024 | 0 | On Market |
| 12 Young St | Price Withheld | 2.0 | 2.0 | 2.0 | 23 Nov 2023 | 0 | On Market |
| 12 Young St | $450,000 | 2.0 | 2.0 | 2.0 | 23 Nov 2023 | 0 | On Market |
Median House Sale Prices by Street (98)
| Street | Date | Median sale value |
|---|---|---|
| Young St | 30 Jun 2024 | 831900.0 |
| Young St | 10 May 2024 | $470,000 |
| Ferry Rd | 06 Oct 2023 | $605,600 |
| Barton St | 06 Oct 2023 | $475,600 |
| Ferry Rd | 31 May 2024 | 420000.0 |
Recent Rental House Listings (100)
| Address | Rent (per week) | Bedrooms | Bathrooms | Garage spaces | Date | Subdivisible into |
|---|---|---|---|---|---|---|
| 88 Barton St | $520 | 4 | 1 | 0 | 27 May 2024 | 0 |
| 88 Barton St | $520 | 4 | 1 | 0 | 27 May 2024 | 0 |
| 88 Barton St | $520 | 4 | 1 | 0 | 27 May 2024 | 0 |
| 88 Barton St | $520 | 4 | 1 | 0 | 27 May 2024 | 0 |
| 88 Barton St | $520 | 4 | 1 | 0 | 27 May 2024 | 0 |
Recently Sold Units (100)
| Address | Price | Bedrooms | Bathrooms | Garage spaces | Date sold | Sale Type |
|---|---|---|---|---|---|---|
| 37 Barton St | $1,700,000 | 23 Feb 2023 | On Market | |||
| 37 Barton St | $1,700,000 | 23 Feb 2023 | On Market | |||
| 37 Barton St | $1,700,000 | 23 Feb 2023 | On Market | |||
| 37 Barton St | $1,700,000 | 23 Feb 2023 | On Market | |||
| 37 Barton St | $1,700,000 | 23 Feb 2023 | On Market |
Loading entities ..