.png)
Profiles
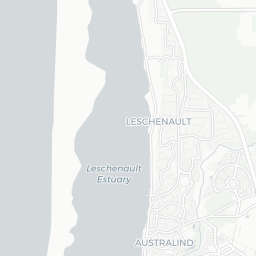
Nearby Suburbs
Real Estate Market: Is Eaton (WA) WA 6232 a Good Suburb to Buy Into?
Housing Market in Eaton (WA)

Sources: Property Listings and Microburbs, 2002 - 2023
| Field | Value | VS Bunbury | Trend | |
|---|---|---|---|---|
| Premium | Premium | Premium | ||
| Premium | Premium | Premium | ||
| Premium | Premium | Premium | ||
| $656 | Top 34% |
|
||
| Premium | Premium | Premium |
Housing Supply in Eaton (WA)

The higher the supply score the more supply is on the market, both current and future.
Sources: ABS, GEOSPATIAL, Property Listings and Microburbs, 2002 - 2023
Sources: ABS, GEOSPATIAL, Property Listings and Microburbs, 2002 - 2023
Eaton (WA)
47.0%
Eaton (WA)
47.0%
Bunbury
43.8%
Bunbury
43.8%
| Field | Value | VS Bunbury | Trend | |
|---|---|---|---|---|
| 0 | Bottom 38% | Data for Jun 2025 | ||
| 2.0 | Bottom 41% | Data for Jul 2023 | ||
| 11.3 | Top 25% | Data for May 2023 | ||
| Premium | Premium | Premium | ||
| Premium | Premium | Premium | ||
| Premium | Premium | Premium | ||
| Premium | Premium | Premium | ||
| Premium | Premium | Premium | ||
| 18 | Top 8% |
|
Housing Stock Quality in Eaton (WA)
The higher the score, the higher the quality of the houses and units.
Sources: ABS, GEOSPATIAL, Property Listings and Microburbs, 2006 - 2023
Sources: ABS, GEOSPATIAL, Property Listings and Microburbs, 2006 - 2023
| Field | Value | VS Bunbury | Trend | |
|---|---|---|---|---|
| 90.6% | Bottom 21% |
|
||
| 2.5 | Top 48% |
|
||
| 77.4% | Top 4% | Data for Jun 2023 |
Development Restrictions in Eaton (WA)

The higher the score, the more easily density can be increased.
Sources: GEOSPATIAL, TORREN, ABS and Microburbs, 2011 - 2023
Sources: GEOSPATIAL, TORREN, ABS and Microburbs, 2011 - 2023
Eaton (WA)
28.2%
Eaton (WA)
28.2%
Bunbury
27.0%
Bunbury
27.0%
| Field | Value | VS Bunbury | Trend | |
|---|---|---|---|---|
| 6.9 sq km | Bottom 48% | Data for Jan 2021 | ||
| 563 sqm per resident | Bottom 32% | Data for Jan 2021 |
Risk in Eaton (WA)

The higher the score, the more exposed households are to financial stress.
Sources: ABS, Property Listings, TORREN and Microburbs, 2006 - 2023
Sources: ABS, Property Listings, TORREN and Microburbs, 2006 - 2023
Eaton (WA)
47.3%
Eaton (WA)
47.3%
Bunbury
52.3%
Bunbury
52.3%
| Field | Value | VS Bunbury | Trend | |
|---|---|---|---|---|
| 90.6% | Bottom 44% |
|
||
| 9.4% | Top 44% |
|
||
| 22 | Bottom 16% | Data for Jun 2023 | ||
| $2,070 | Top 42% |
|
||
| 80 | Top 39% | Data for Jun 2023 | ||
| 73 | Bottom 34% | Data for Jun 2023 | ||
| 23.5% | Top 43% |
|
||
| 46.8% | Top 28% |
|
Housing Demand in Eaton (WA)
The higher the score, the more demand their is for housing in the area, both current and future.
Sources: ABS, TORREN, Property Listings and Microburbs, 2004 - 2030
Sources: ABS, TORREN, Property Listings and Microburbs, 2004 - 2030
Eaton (WA)
48.7%
Eaton (WA)
48.7%
Bunbury
48.1%
Bunbury
48.1%
| Field | Value | VS Bunbury | Trend | |
|---|---|---|---|---|
| Premium | Premium | Premium | ||
| Premium | Premium | Premium | ||
| 16800 | Top 26% |
|
||
| 114000 | Top 21% |
|
||
| Premium | Premium | Premium | ||
| 16200 | Top 46% |
|
||
| Premium | Premium | Premium | ||
| Premium | Premium | Premium | ||
| Premium | Premium | Premium | ||
| Premium | Premium | Premium |
Unit Market in Eaton (WA)
Sources: Property Listings and Microburbs, 2002 - 2023
| Field | Value | VS Bunbury | Trend | |
|---|---|---|---|---|
| Premium | Premium | Premium | ||
| Premium | Premium | Premium | ||
| Premium | Premium | Premium | ||
| $565 | Top 40% |
|
||
| Premium | Premium | Premium | ||
| 74.6% | Top 44% |
|
Businesses (16)
| Name | Address |
|---|---|
| Kell's Bobcats & Truck Hire | 15 Hamilton Rd, Eaton WA 6232, Australia |
| Bunbury & Districts Electrical Test & Tag Service | |
| Gilectrics Electrical Contractors Pty Ltd | 8 Fowler Ct, Eaton WA 6232, Australia |
| SK & Sons Concrete Solutions | 58 Peppermint Way, Eaton WA 6232, Australia |
| Home Timber & Hardware Eaton Hardware | 1 Cassowary Bend, Eaton WA 6232, Australia |
Accommodation Options (2)
| Name | Address |
|---|---|
| Bethanie Fields | 111, Eaton Drv |
| All Seasons Sanctuary Golf Resort | PO Box 7008 |
Median House Rental Prices by Street (29)
| Street | Date | Median rent (per week) |
|---|---|---|
| Flinders St | 25 Apr 2025 | $630 |
| Eagle Cr | 25 Apr 2025 | $600 |
| Hamilton Rd | 25 Apr 2025 | $625 |
| Hale St | 25 Apr 2025 | $580 |
| Glenhuon Bvd | 25 Apr 2025 | $625 |
Median Unit Sale Prices by Street (100)
| Date | Median sale value | Street |
|---|---|---|
| 10 May 2024 | $270,000 | Pratt Rd |
| 10 May 2024 | $294,500 | Blue Wren Dr |
| 10 May 2024 | $367,800 | Camfield St |
| 10 May 2024 | $477,400 | Illawarra Dr |
| 10 May 2024 | $325,000 | Eagle Cr |
Turnover Rate by Street (100)
| Turnover rate | Street | Turnover Label | Turnover Years | Year |
|---|---|---|---|---|
| 85.7% | Romney Way | average turnover | Every 11.7 years (average turnover) | 2025 |
| 89.3% | Hamilton Rd | high turnover | Every 11.2 years (high turnover) | 2025 |
| 34.8% | Monash Bvd | very tightly held | Every 28.8 years (very tightly held) | 2025 |
| 135.7% | Illawarra Dr | very high turnover | Every 7.4 years (very high turnover) | 2025 |
| 80.0% | Solomon St | average turnover | Every 12.5 years (average turnover) | 2025 |
LGA Details (1)
| Headline | Place | Datetime |
|---|---|---|
| Local government area | Dardanup |
Percent of Renters by Street (100)
| Percent of Renters | Street |
|---|---|
| 0.0% | Abe Ct |
| 34.5% | Acer Glde |
| 15.9% | Albatross Cr |
| 33.3% | Ali Ct |
| 0.0% | Anglesea Way |
Median House Sale Prices by Street (100)
| Street | Date | Median sale value |
|---|---|---|
| Cleveland Bay Ave | 10 May 2024 | $594,100 |
| Charterhouse St | 10 May 2024 | $472,500 |
| Diadem St | 10 May 2024 | $417,000 |
| Crampton Ave | 10 May 2024 | $500,000 |
| Short St | 10 May 2024 | $426,000 |
Recently Sold Houses (100)
| Address | Price | Bedrooms | Bathrooms | Garage spaces | Date sold | Subdivisible into | Sale Type |
|---|---|---|---|---|---|---|---|
| 77 Millard St | $655,000 | 4.0 | 2.0 | 2.0 | 23 Apr 2025 | 0 | On Market |
| 51 Hale St | Price Withheld | 4.0 | 2.0 | 2.0 | 14 Apr 2025 | 0 | On Market |
| 51 Hale St | $820,000 | 4.0 | 2.0 | 2.0 | 14 Apr 2025 | 0 | On Market |
| 6 May Pl | Price Withheld | 3.0 | 1.0 | 3.0 | 08 Apr 2025 | 0 | On Market |
| 8 Sindhi Cl | $695,000 | 5.0 | 2.0 | 2.0 | 04 Apr 2025 | 0 | On Market |
Recent Rental House Listings (100)
| Address | Rent (per week) | Bedrooms | Bathrooms | Garage spaces | Date | Subdivisible into |
|---|---|---|---|---|---|---|
| 11 Ann St | $520 | 3 | 1 | 17 Apr 2025 | 0 | |
| 11 Ann St | $520 | 3 | 1 | 17 Apr 2025 | 0 | |
| 11 Ann St | $520 | 3 | 1 | 17 Apr 2025 | 0 | |
| 11 Ann St | $520 | 3 | 1 | 17 Apr 2025 | 0 | |
| 11 Ann St | $520 | 3 | 1 | 17 Apr 2025 | 0 |
Recent Rental Unit Listings (100)
| Address | Rent (per week) | Bedrooms | Bathrooms | Garage spaces | Date |
|---|---|---|---|---|---|
| Unit 3, 35 Blue Wren Dr | $620 | 3.0 | 2.0 | 1.0 | 10 Apr 2025 |
| Unit 3, 35 Blue Wren Dr | $620 | 3.0 | 2.0 | 1.0 | 10 Apr 2025 |
| Unit 3, 35 Blue Wren Dr | $620 | 3.0 | 2.0 | 1.0 | 10 Apr 2025 |
| Unit 3, 35 Blue Wren Dr | $620 | 3.0 | 2.0 | 1.0 | 10 Apr 2025 |
| Unit 3, 35 Blue Wren Dr | $620 | 3.0 | 2.0 | 1.0 | 10 Apr 2025 |
Recently Sold Units (100)
| Address | Price | Bedrooms | Bathrooms | Garage spaces | Date sold | Sale Type |
|---|---|---|---|---|---|---|
| Unit 3, 13 Foster St | $590,000 | 4.0 | 2.0 | 2.0 | 08 Mar 2025 | On Market |
| Unit 3, 13 Foster St | $590,000 | 4.0 | 2.0 | 2.0 | 08 Mar 2025 | On Market |
| Unit 3, 13 Foster St | Price Withheld | 4.0 | 2.0 | 2.0 | 08 Mar 2025 | On Market |
| Unit 3, 13 Foster St | Price Withheld | 4.0 | 2.0 | 2.0 | 08 Mar 2025 | On Market |
| Unit 3, 13 Foster St | $590,000 | 4.0 | 2.0 | 2.0 | 08 Mar 2025 | On Market |
Loading entities ..