.png)
Profiles
Nearby Suburbs
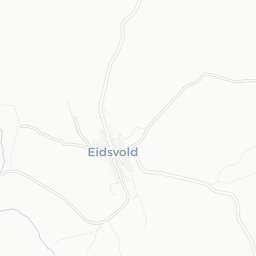
Real Estate Market: Is Eidsvold QLD 4627 a Good Suburb to Buy Into?
Housing Market in Eidsvold

Sources: Property Listings and Microburbs, 2002 - 2023
| Field | Value | VS Wide Bay | Trend | |
|---|---|---|---|---|
| Premium | Premium | Premium | ||
| Premium | Premium | Premium | ||
| Premium | Premium | Premium | ||
| $423 | Bottom 7% |
|
||
| Premium | Premium | Premium |
Housing Supply in Eidsvold

The higher the supply score the more supply is on the market, both current and future.
Sources: ABS, GEOSPATIAL, Property Listings and Microburbs, 2002 - 2023
Sources: ABS, GEOSPATIAL, Property Listings and Microburbs, 2002 - 2023
Eidsvold
58.7%
Eidsvold
58.7%
Wide Bay
40.0%
Wide Bay
40.0%
| Field | Value | VS Wide Bay | Trend | |
|---|---|---|---|---|
| 0 | Bottom 38% | Data for Jun 2025 | ||
| 2.0 | Bottom 41% | Data for Jul 2023 | ||
| Premium | Premium | Premium | ||
| Premium | Premium | Premium | ||
| Premium | Premium | Premium | ||
| Premium | Premium | Premium | ||
| Premium | Premium | Premium | ||
| 2 | Top 31% | Data for Apr 2025 |
Housing Stock Quality in Eidsvold
The higher the score, the higher the quality of the houses and units.
Sources: ABS, GEOSPATIAL, Property Listings and Microburbs, 2006 - 2023
Sources: ABS, GEOSPATIAL, Property Listings and Microburbs, 2006 - 2023
| Field | Value | VS Wide Bay | Trend | |
|---|---|---|---|---|
| 87.0% | Bottom 17% |
|
||
| 2.2 | Bottom 26% |
|
||
| 0.0% | Bottom 37% | Data for Jun 2023 |
Development Restrictions in Eidsvold

The higher the score, the more easily density can be increased.
Sources: GEOSPATIAL, TORREN, ABS and Microburbs, 2011 - 2023
Sources: GEOSPATIAL, TORREN, ABS and Microburbs, 2011 - 2023
Eidsvold
32.4%
Eidsvold
32.4%
Wide Bay
35.5%
Wide Bay
35.5%
| Field | Value | VS Wide Bay | Trend | |
|---|---|---|---|---|
| 94.0 sq km | Top 12% | Data for Jan 2021 | ||
| 0.0 sq km | Top 11% | Data for Jun 2023 | ||
| 5030 sqm per resident | Top 25% | Data for Jan 2021 |
Risk in Eidsvold

The higher the score, the more exposed households are to financial stress.
Sources: ABS, Property Listings, TORREN and Microburbs, 2006 - 2023
Sources: ABS, Property Listings, TORREN and Microburbs, 2006 - 2023
Eidsvold
27.2
Eidsvold
27.2
Wide Bay
44.0
Wide Bay
44.0
| Field | Value | VS Wide Bay | Trend | |
|---|---|---|---|---|
| 95.2% | Top 37% |
|
||
| 4.8% | Bottom 37% |
|
||
| 17 | Bottom 4% | Data for Jun 2023 | ||
| $206 | Bottom 1% |
|
||
| 85 | Top 14% | Data for Jun 2023 | ||
| 77 | Top 44% | Data for Jun 2023 | ||
| 21.9% | Bottom 48% |
|
||
| 22.9% | Bottom 11% |
|
Housing Demand in Eidsvold
The higher the score, the more demand their is for housing in the area, both current and future.
Sources: ABS, TORREN, Property Listings and Microburbs, 2006 - 2030
Sources: ABS, TORREN, Property Listings and Microburbs, 2006 - 2030
Eidsvold
33.1%
Eidsvold
33.1%
Wide Bay
53.8%
Wide Bay
53.8%
| Field | Value | VS Wide Bay | Trend | |
|---|---|---|---|---|
| Premium | Premium | Premium | ||
| Premium | Premium | Premium | ||
| 3480 | Bottom 15% |
|
||
| 51600 | Bottom 36% |
|
||
| Premium | Premium | Premium | ||
| 11100 | Bottom 45% |
|
||
| Premium | Premium | Premium | ||
| Premium | Premium | Premium |
Unit Market in Eidsvold
Sources: Property Listings and Microburbs, 2002 - 2023
| Field | Value | VS Wide Bay | Trend | |
|---|---|---|---|---|
| Premium | Premium | Premium | ||
| $253 | Bottom 0% |
|
||
| Premium | Premium | Premium | ||
| 192.0% | Top 1% |
|
LGA Details (1)
| Headline | Place | Datetime |
|---|---|---|
| Local government area | North Burnett |
Accommodation Options (2)
| Headline | Place | Datetime |
|---|---|---|
| Star Hotel Motel | 2 Hodgkinson St | |
Percent of Renters by Street (28)
| Percent of Renters | Street |
|---|---|
| 0.0% | Cedar Creek Rd |
| 0.0% | Alma Vale Rd |
| 0.0% | Burnett Hwy |
| 0.0% | Frederick St |
| 0.0% | Crown St |
Turnover Rate by Street (26)
| Turnover rate | Street | Turnover Label | Turnover Years | Year |
|---|---|---|---|---|
| 88.8% | Moreton St | high turnover | Every 11.3 years (high turnover) | 2025 |
| 83.3% | Golden Spur St | average turnover | Every 12.0 years (average turnover) | 2025 |
| 125.0% | Ryan St | very high turnover | Every 8.0 years (very high turnover) | 2025 |
| 71.0% | Mount Rose St | average turnover | Every 14.1 years (average turnover) | 2025 |
| 123.1% | Macdonald St | very high turnover | Every 8.1 years (very high turnover) | 2025 |
Median Unit Sale Prices by Street (1)
| Date | Median sale value | Street |
|---|---|---|
| 10 May 2024 | $285,000 | Moreton St |
Recently Sold Houses (96)
| Address | Price | Bedrooms | Bathrooms | Garage spaces | Date sold | Subdivisible into | Sale Type |
|---|---|---|---|---|---|---|---|
| 79 Moreton St | $217,500 | 2.0 | 1.0 | 2.0 | 12 Mar 2025 | 0 | On Market |
| 37 Moreton St | Price Withheld | 7.0 | 3.0 | 0.0 | 25 Feb 2025 | 0 | On Market |
| 2 Loader Bill Dr | $40,000 | 0.0 | 12 Feb 2025 | 0 | On Market | ||
| 17 Shield Ave | $215,000 | 3.0 | 1.0 | 0.0 | 06 Feb 2025 | 0 | On Market |
| 9 Hodgkinson St | Price Withheld | 2.0 | 1.0 | 4.0 | 13 Jan 2025 | 0 | On Market |
Businesses (1)
| Name | Address |
|---|---|
| Parkside Group | Cracow Rd |
Median House Sale Prices by Street (100)
| Street | Date | Median sale value |
|---|---|---|
| Esplanade St | 10 May 2024 | $145,000 |
| Golden Spur St | 10 May 2024 | $157,500 |
| Moreton St | 10 May 2024 | $209,500 |
| Mount Rose St | 06 Oct 2023 | $140,700 |
| Macdonald St | 06 Oct 2023 | $310,000 |
Recent Rental House Listings (100)
| Address | Rent (per week) | Bedrooms | Bathrooms | Garage spaces | Date | Subdivisible into |
|---|---|---|---|---|---|---|
| Unit 1, 5 Ryan St | $260 | 2 | 1 | 1 | 08 Apr 2024 | 0 |
| Unit 1, 5 Ryan St | $260 | 2 | 1 | 1 | 08 Apr 2024 | 0 |
| Unit 1, 5 Ryan St | $260 | 2 | 1 | 1 | 08 Apr 2024 | 0 |
| Unit 1, 5 Ryan St | $260 | 2 | 1 | 1 | 08 Apr 2024 | 0 |
| Unit 1, 5 Ryan St | $260 | 2 | 1 | 1 | 08 Apr 2024 | 0 |
Recent Rental Unit Listings (100)
| Address | Rent (per week) | Bedrooms | Bathrooms | Garage spaces | Date |
|---|---|---|---|---|---|
| Unit 1, 5 Ryan St | $260 | 2.0 | 1.0 | 1.0 | 08 Apr 2024 |
| Unit 1, 5 Ryan St | $260 | 2.0 | 1.0 | 1.0 | 08 Apr 2024 |
| Unit 1, 5 Ryan St | $260 | 2.0 | 1.0 | 1.0 | 08 Apr 2024 |
| Unit 1, 5 Ryan St | $260 | 2.0 | 1.0 | 1.0 | 08 Apr 2024 |
| Unit 1, 5 Ryan St | $260 | 2.0 | 1.0 | 1.0 | 08 Apr 2024 |
Recently Sold Units (100)
| Address | Price | Bedrooms | Bathrooms | Garage spaces | Date sold | Sale Type |
|---|---|---|---|---|---|---|
| 303 Spring Gully Rd | $310,000 | 0.0 | 0.0 | 0.0 | 27 Nov 2024 | On Market |
| 303 Spring Gully Rd | $310,000 | 0.0 | 0.0 | 0.0 | 27 Nov 2024 | On Market |
| 303 Spring Gully Rd | $310,000 | 0.0 | 0.0 | 0.0 | 27 Nov 2024 | On Market |
| 303 Spring Gully Rd | $310,000 | 0.0 | 0.0 | 0.0 | 27 Nov 2024 | On Market |
| 303 Spring Gully Rd | $310,000 | 0.0 | 0.0 | 0.0 | 27 Nov 2024 | On Market |
Loading entities ..