.png)
Profiles
Nearby Suburbs
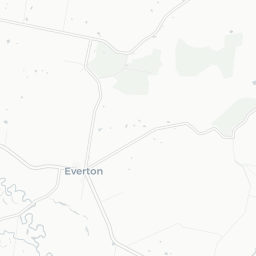
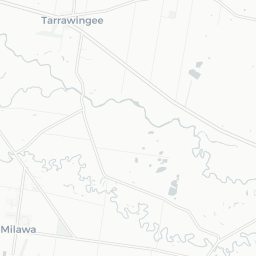
Real Estate Market: Is Everton Upper VIC 3678 a Good Suburb to Buy Into?
Housing Market in Everton Upper

Sources: Property Listings and Microburbs, 2002 - 2023
| Field | Value | VS Hume | Trend | |
|---|---|---|---|---|
| Premium | Premium | Premium | ||
| Premium | Premium | Premium | ||
| Premium | Premium | Premium | ||
| $483 | Bottom 17% |
|
||
| Premium | Premium | Premium |
Housing Supply in Everton Upper

The higher the supply score the more supply is on the market, both current and future.
Sources: ABS, GEOSPATIAL, Property Listings, PLANNING ALERTS and Microburbs, 2002 - 2023
Sources: ABS, GEOSPATIAL, Property Listings, PLANNING ALERTS and Microburbs, 2002 - 2023
Everton Upper
48.3%
Everton Upper
48.3%
Hume
36.0%
Hume
36.0%
| Field | Value | VS Hume | Trend | |
|---|---|---|---|---|
| 2,780 | Top 1% |
|
||
| 2.5 | Top 46% | Data for Jul 2023 | ||
| Premium | Premium | Premium | ||
| Premium | Premium | Premium | ||
| Premium | Premium | Premium | ||
| Premium | Premium | Premium | ||
| 0 | Bottom 24% | Data for Mar 2025 |
Housing Stock Quality in Everton Upper
The higher the score, the higher the quality of the houses and units.
Sources: ABS, GEOSPATIAL, Property Listings and Microburbs, 2006 - 2023
Sources: ABS, GEOSPATIAL, Property Listings and Microburbs, 2006 - 2023
| Field | Value | VS Hume | Trend | |
|---|---|---|---|---|
| 100.0% | Top 31% | Data for Jan 2021 | ||
| 2.7 | Top 30% |
|
||
| 0.0% | Bottom 37% | Data for Jun 2023 |
Development Restrictions in Everton Upper

The higher the score, the more easily density can be increased.
Sources: GEOSPATIAL, TORREN and Microburbs, 2011 - 2023
Sources: GEOSPATIAL, TORREN and Microburbs, 2011 - 2023
Everton Upper
18.1%
Everton Upper
18.1%
Hume
25.1%
Hume
25.1%
| Field | Value | VS Hume | Trend | |
|---|---|---|---|---|
| 0.0 sq km | Top 46% | Data for Jun 2023 |
Risk in Everton Upper

The higher the score, the more exposed households are to financial stress.
Sources: ABS, Property Listings, TORREN and Microburbs, 2006 - 2023
Sources: ABS, Property Listings, TORREN and Microburbs, 2006 - 2023
Everton Upper
34.5
Everton Upper
34.5
Hume
32.1
Hume
32.1
| Field | Value | VS Hume | Trend | |
|---|---|---|---|---|
| 100.0% | Top 11% | Data for May 2023 | ||
| 0.0% | Bottom 11% | Data for May 2023 | ||
| 41 | Top 27% | Data for Jun 2023 | ||
| $802 | Bottom 6% |
|
||
| 82 | Top 29% | Data for Jun 2023 | ||
| 78 | Top 34% | Data for Jun 2023 | ||
| 16.3% | Bottom 24% |
|
||
| 33.6% | Bottom 36% |
|
Housing Demand in Everton Upper
The higher the score, the more demand their is for housing in the area, both current and future.
Sources: ABS, TORREN, Property Listings and Microburbs, 2006 - 2030
Sources: ABS, TORREN, Property Listings and Microburbs, 2006 - 2030
Everton Upper
41.9%
Everton Upper
41.9%
Hume
49.4%
Hume
49.4%
| Field | Value | VS Hume | Trend | |
|---|---|---|---|---|
| Premium | Premium | Premium | ||
| Premium | Premium | Premium | ||
| 10200 | Bottom 40% |
|
||
| 48700 | Bottom 33% |
|
||
| Premium | Premium | Premium | ||
| 30700 | Top 36% |
|
||
| Premium | Premium | Premium | ||
| Premium | Premium | Premium |
Unit Market in Everton Upper
Sources: Property Listings and Microburbs, 2002 - 2023
| Field | Value | VS Hume | Trend | |
|---|---|---|---|---|
| Premium | Premium | Premium | ||
| 156.0% | Top 1% |
|
Percent of Renters by Street (12)
| Percent of Renters | Street |
|---|---|
| 0.0% | Airey Ln |
| 11.5% | Beechworth-Wangaratta Rd |
| 0.0% | Bennetts Ln |
| 0.0% | Boundary Rd |
| 0.0% | Dickens Rd |
Turnover Rate by Street (10)
| Turnover rate | Street | Turnover Label | Turnover Years | Year |
|---|---|---|---|---|
| 100.0% | Boundary Rd | high turnover | Every 10.0 years (high turnover) | 2025 |
| 50.0% | Oxenbury Ln | very tightly held | Every 20.0 years (very tightly held) | 2025 |
| 100.0% | Airey Ln | high turnover | Every 10.0 years (high turnover) | 2025 |
| 60.0% | White Post Rd | quite tightly held | Every 16.7 years (quite tightly held) | 2025 |
| 100.0% | Diffey Rd | high turnover | Every 10.0 years (high turnover) | 2025 |
LGA Details (1)
| Headline | Place | Datetime |
|---|---|---|
| Local government area | Wangaratta |
Planning Applications: Dwellings (7)
| Headline | Place | Date |
|---|---|---|
| Buildings and works for the construction of a dwelling and removal of native vegetation - Rural City of Wangaratta PlnApp24/136 | 462 Masons Road Everton Upper VIC 3678 | 24 Aug 2024 |
| Use and development of the land for a dwelling, two outbuildings and a domestic swimming pool - Rural City of Wangaratta PlnApp24/116 | 1128 Beechworth-Wangaratta Road Everton Upper VIC 3678 | 25 Jul 2024 |
| Development of a Dwelling - Rural City of Wangaratta PlnApp22/123 | 341 Dickens Road Tarrawingee VIC 3678 | 28 Jul 2022 |
| Use and Development of Land for a Second Dwelling - Rural City of Wangaratta PlnApp21/168 | 1476 Beechworth-Wangaratta Road Everton Upper VIC 3678 | 05 Aug 2021 |
| Development of a Replacement Dwelling - Rural City of Wangaratta PlnApp19/129.01 | 14 Peppercorn Rise Everton Upper VIC 3678 | 20 Jun 2021 |
Recently Sold Houses (16)
| Address | Price | Bedrooms | Bathrooms | Garage spaces | Date sold | Subdivisible into | Sale Type |
|---|---|---|---|---|---|---|---|
| 1271 Beechworth-wangaratta Rd | $1,055,000 | 5.0 | 3.0 | 4.0 | 19 Mar 2025 | 0 | On Market |
| 48 Oxenbury Ln | $850,000 | 4.0 | 2.0 | 2.0 | 29 Jun 2023 | 0 | On Market |
| 6 Boundary Rd | Price Withheld | 4.0 | 1.0 | 3.0 | 16 Oct 2021 | 0 | On Market |
| 6 Boundary Rd | $406,600 | 4.0 | 1.0 | 3.0 | 16 Oct 2021 | 0 | On Market |
| 211 Farmers Rd | $1,400,000 | 4.0 | 2.0 | 16 Aug 2021 | 0 | On Market |
Median House Sale Prices by Street (80)
| Street | Date | Median sale value |
|---|---|---|
| White Post Rd | 31 May 2024 | 339100.0 |
| Oxenbury Ln | 06 Oct 2023 | $850,000 |
| Boundary Rd | 06 Oct 2023 | $558,500 |
| Beechworth-Wangaratta Rd | 06 Oct 2023 | $850,000 |
| Farmers Rd | 06 Oct 2023 | $1,587,000 |
Recent Rental House Listings (100)
| Address | Rent (per week) | Bedrooms | Bathrooms | Garage spaces | Date | Subdivisible into |
|---|---|---|---|---|---|---|
| 1645 Beechworth-wangaratta Rd | $480 | 6 | 4 | 3 | 01 Mar 2019 | 0 |
| 1645 Beechworth-wangaratta Rd | $480 | 6 | 4 | 3 | 01 Mar 2019 | 0 |
| 1645 Beechworth-wangaratta Rd | $480 | 6 | 4 | 3 | 01 Mar 2019 | 0 |
| 1645 Beechworth-wangaratta Rd | $480 | 6 | 4 | 3 | 01 Mar 2019 | 0 |
| 1645 Beechworth-wangaratta Rd | $480 | 6 | 4 | 3 | 01 Mar 2019 | 0 |
Recently Sold Units (100)
| Address | Price | Bedrooms | Bathrooms | Garage spaces | Date sold | Sale Type |
|---|---|---|---|---|---|---|
| 1271 Beechworth-wangaratta Rd | $1,055,000 | 5.0 | 3.0 | 4.0 | 19 Mar 2025 | On Market |
| 1271 Beechworth-wangaratta Rd | $1,055,000 | 5.0 | 3.0 | 4.0 | 19 Mar 2025 | On Market |
| 991 Beechworth-wangaratta Rd | $650,000 | 03 Mar 2022 | On Market | |||
| 991 Beechworth-wangaratta Rd | $650,000 | 03 Mar 2022 | On Market | |||
| 991 Beechworth-wangaratta Rd | $650,000 | 03 Mar 2022 | On Market |
Loading entities ..