.png)
Profiles
Nearby Suburbs
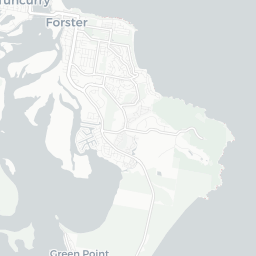
Forster (NSW): Family-friendly, outdoor activities, scenic views, historical.
Housing Market in Forster (NSW)

Sources: Property Listings, TORREN and Microburbs, 2002 - 2023
| Field | Value | VS Mid North Coast NSW | Trend | |
|---|---|---|---|---|
| Premium | Premium | Premium | ||
| Premium | Premium | Premium | ||
| Premium | Premium | Premium | ||
| $618 | Top 45% |
|
||
| Premium | Premium | Premium |
Housing Supply in Forster (NSW)

The higher the supply score the more supply is on the market, both current and future.
Sources: ABS, GEOSPATIAL, Property Listings, PLANNING ALERTS, BASIX and Microburbs, 2002 - 2031
Sources: ABS, GEOSPATIAL, Property Listings, PLANNING ALERTS, BASIX and Microburbs, 2002 - 2031
Forster (NSW)
34.6%
Forster (NSW)
34.6%
Mid North Coast NSW
41.1%
Mid North Coast NSW
41.1%
| Field | Value | VS Mid North Coast NSW | Trend | |
|---|---|---|---|---|
| 1,470 | Top 3% |
|
||
| 3.2 | Top 39% | Data for Jul 2023 | ||
| 63.9 | Top 10% | Data for May 2023 | ||
| Premium | Premium | Premium | ||
| Premium | Premium | Premium | ||
| Premium | Premium | Premium | ||
| 110 | Top 4% | Data for Dec 2020 | ||
| 2 lots | Bottom 15% |
|
||
| Premium | Premium | Premium | ||
| Premium | Premium | Premium | ||
| Premium | Premium | Premium | ||
| 72 | Top 1% |
|
Housing Stock Quality in Forster (NSW)
The higher the score, the higher the quality of the houses and units.
Sources: ABS, GEOSPATIAL, Property Listings, BASIX and Microburbs, 2006 - 2023
Sources: ABS, GEOSPATIAL, Property Listings, BASIX and Microburbs, 2006 - 2023
| Field | Value | VS Mid North Coast NSW | Trend | |
|---|---|---|---|---|
| 65.9% | Bottom 7% |
|
||
| 2.1 | Bottom 20% |
|
||
| 35.9% | Top 9% | Data for Jun 2023 | ||
| Premium | Premium | Premium |
Development Restrictions in Forster (NSW)

The higher the score, the more easily density can be increased.
Sources: GEOSPATIAL, TORREN, ABS and Microburbs, 2011 - 2023
Sources: GEOSPATIAL, TORREN, ABS and Microburbs, 2011 - 2023
Forster (NSW)
19.3%
Forster (NSW)
19.3%
Mid North Coast NSW
24.0%
Mid North Coast NSW
24.0%
| Field | Value | VS Mid North Coast NSW | Trend | |
|---|---|---|---|---|
| 35.0 sq km | Top 28% | Data for Jan 2021 | ||
| 0.60 | Bottom 39% | Data for Feb 2023 | ||
| 11.0% | Top 10% | Data for Jun 2023 | ||
| 10 | Top 16% | Data for Jun 2023 | ||
| 641 sqm per resident | Bottom 35% | Data for Jan 2021 |
Risk in Forster (NSW)

The higher the score, the more exposed households are to financial stress.
Sources: ABS, Property Listings, TORREN and Microburbs, 2006 - 2023
Sources: ABS, Property Listings, TORREN and Microburbs, 2006 - 2023
Forster (NSW)
76.8%
Forster (NSW)
76.8%
Mid North Coast NSW
70.3%
Mid North Coast NSW
70.3%
| Field | Value | VS Mid North Coast NSW | Trend | |
|---|---|---|---|---|
| 82.1% | Bottom 20% |
|
||
| 17.9% | Top 20% |
|
||
| 54 | Top 10% | Data for Jun 2023 | ||
| $2,080 | Top 41% |
|
||
| 69 | Bottom 10% | Data for Jun 2023 | ||
| 66 | Bottom 11% | Data for Jun 2023 | ||
| 39.5% | Top 5% |
|
||
| 23.2% | Bottom 12% |
|
Housing Demand in Forster (NSW)
The higher the score, the more demand their is for housing in the area, both current and future.
Sources: ABS, TORREN, Property Listings and Microburbs, 2004 - 2030
Sources: ABS, TORREN, Property Listings and Microburbs, 2004 - 2030
Forster (NSW)
63.4%
Forster (NSW)
63.4%
Mid North Coast NSW
60.8%
Mid North Coast NSW
60.8%
| Field | Value | VS Mid North Coast NSW | Trend | |
|---|---|---|---|---|
| Premium | Premium | Premium | ||
| 16600 | Top 29% |
|
||
| 33600 | Bottom 18% |
|
||
| Premium | Premium | Premium | ||
| 101000 | Top 17% |
|
||
| Premium | Premium | Premium | ||
| Premium | Premium | Premium | ||
| Premium | Premium | Premium | ||
| Premium | Premium | Premium |
Unit Market in Forster (NSW)
Sources: Property Listings and Microburbs, 2002 - 2023
| Field | Value | VS Mid North Coast NSW | Trend | |
|---|---|---|---|---|
| Premium | Premium | Premium | ||
| Premium | Premium | Premium | ||
| Premium | Premium | Premium | ||
| $431 | Bottom 26% |
|
||
| Premium | Premium | Premium | ||
| 85.6% | Top 20% |
|
LGA Details (1)
| Headline | Place | Datetime |
|---|---|---|
| Local government area | Mid-Coast |
Median House Rental Prices by Street (56)
| Level_0 | Street | Date | Median rent (per week) |
|---|---|---|---|
| 89355 | Goldens Rd | 18 Apr 2025 | $560 |
| 89354 | Gleneon Dr | 18 Apr 2025 | $550 |
| 89319 | Elouera Cr | 18 Apr 2025 | $700 |
| 89410 | Isabella Pde | 18 Apr 2025 | $700 |
| 89409 | Iluka Bvd | 18 Apr 2025 | $700 |
Turnover Rate by Street (100)
| Turnover rate | Street | Turnover Label | Turnover Years | Year |
|---|---|---|---|---|
| 93.4% | Head St | high turnover | Every 10.7 years (high turnover) | 2025 |
| 71.4% | Breckenridge St | average turnover | Every 14.0 years (average turnover) | 2025 |
| 90.0% | Lincoln St | high turnover | Every 11.1 years (high turnover) | 2025 |
| 57.1% | Robina Gr | quite tightly held | Every 17.5 years (quite tightly held) | 2025 |
| 119.2% | Maneela St | very high turnover | Every 8.4 years (very high turnover) | 2025 |
Median Unit Sale Prices by Street (100)
| Date | Median sale value | Street |
|---|---|---|
| 10 May 2024 | $1,362,000 | Becker Rd |
| 10 May 2024 | $465,000 | Bruce St |
| 10 May 2024 | $360,000 | Cape Hawke Dr |
| 10 May 2024 | $339,000 | Helen St |
| 10 May 2024 | $532,500 | Fairway Cr |
Median House Sale Prices by Street (100)
| Street | Date | Median sale value |
|---|---|---|
| Garden St | 25 Apr 2024 | $627,000 |
| Breese Pde | 10 May 2024 | $530,000 |
| Breckenridge St | 10 May 2024 | $663,000 |
| Burke Cl | 10 May 2024 | $800,000 |
| Burgess Rd | 10 May 2024 | $1,995,000 |
Percent of Renters by Street (100)
| Percent of Renters | Street |
|---|---|
| 30.3% | Adina Cl |
| 21.6% | Affleck Cl |
| 8.3% | Akala Ave |
| 17.1% | Alice St |
| 5.8% | Allen Ave |
Businesses (75)
| Name | Address |
|---|---|
| Pycon Display Home Forster | 97 Kentia Dr, Forster NSW 2428, Australia |
| G&S Quigg Concreting | 24 Churchill Rd, Forster NSW 2428, Australia |
| Hyline Formwork PTY Ltd. | |
| Lidbury Summers & Whiteman | 3 Wharf St, Forster NSW 2428, Australia |
| Allan's Fencing | 56 Kularoo Dr, Forster NSW 2428, Australia |
Accommodation Options (25)
| Name | Address |
|---|---|
| Beaches International | 1 Beach St, Forster NSW 2428, Australia |
| The Dorsal Boutique Hotel | 1 West St, Forster NSW 2428, Australia |
| Hotel Forster | 26 The Lakes Way, Forster NSW 2428, Australia |
| Lakeside Forster Park | 13 Tea Tree Rd, Forster NSW 2428, Australia |
| Sails Apartments | 7/15 Head St, Forster NSW 2428, Australia |
Recently Sold Houses (100)
| Address | Price | Bedrooms | Bathrooms | Garage spaces | Date sold | Subdivisible into | Sale Type |
|---|---|---|---|---|---|---|---|
| 31 Limestone Cr | $1,660,000 | 4.0 | 2.0 | 2.0 | 14 Apr 2025 | 0 | On Market |
| 17 Colliton Pde | $1,110,000 | 4.0 | 2.0 | 2.0 | 11 Apr 2025 | 0 | On Market |
| Unit 2, 11 Bright St | $615,000 | 3.0 | 2.0 | 1.0 | 11 Apr 2025 | 0 | On Market |
| 1 Royal Cl | $754,000 | 3.0 | 1.0 | 4.0 | 10 Apr 2025 | 0 | On Market |
| Unit 13, 12 Goldens Rd | $295,000 | 2.0 | 1.0 | 1.0 | 09 Apr 2025 | 0 | On Market |
Planning Applications: Dwellings (72)
| Headline | Place | Date |
|---|---|---|
| Multi Dwelling Housing; Stage 1- Single Dwelling Stage 2- Dwelling Alterations & Additions Stage 3- Alterations & Additions to create Multi Dwelling Housing - Mid-Coast Council DA2025/0223 | 20 Lovedale Way Forster NSW 2428 | 03 Apr 2025 |
| Demolish existing patio cover and construct new patio cover - Mid-Coast Council DA2025/0225 | 41 Panorama Crescent Forster NSW 2428 | 28 Mar 2025 |
| Construction Certificate Private Certifier Issue - A structure being a fence/mast/swimming pool, A single dwelling - Exhibition Home and Advertising Signage - Mid-Coast Council CC2025/0170 | 1 Algona Road Forster NSW 2428 | 26 Mar 2025 |
| Construction Certificate Private Certifier Issue - A single dwelling - Dwelling Additions - Mid-Coast Council CC2025/0165 | 16 Marine Drive Forster NSW 2428 | 24 Mar 2025 |
| Construction Certificate Private Certifier Issue - Multi-unit residential building - Residential Flat Building - Mid-Coast Council CC2025/0148 | 29 Wallis Street Forster NSW 2428 | 20 Mar 2025 |
Planning Applications: Other (28)
| Headline | Place | Date |
|---|---|---|
| Construction Certificate Private Certifier Issue - Non habitable - balconies patios carport terraces - Deck - Mid-Coast Council CC2025/0142 | 37 Burgess Road Forster NSW 2428 | 20 Mar 2025 |
| Complying Development Certificates - Private Issued Complying Development Certificate - Internal Demolition & Reconfiguration to Bar Area - Mid-Coast Council CDC2025/0041 | 10 Little Street Forster NSW 2428 | 18 Mar 2025 |
| Construction Certificate Private Certifier Issue - Non habitable - balconies patios carport terraces - Demolition, and dwelling alterations and additions - Mid-Coast Council CC2025/0136 | 20 Daphne Street Forster NSW 2428 | 14 Mar 2025 |
| Construction Certificate Private Certifier Issue - Non habitable - balconies patios carport terraces - Revetment Wall and Jetty - Mid-Coast Council CC2025/0134 | 8 Murray Avenue Forster NSW 2428 | 14 Mar 2025 |
| Construction Certificate Private Certifier Issue - Aged care buildings - Extension to Caravan Park - 58 relocatable home sites - Mid-Coast Council CC2025/0117 | 6-8 Tea Tree Road Forster NSW 2428 | 07 Mar 2025 |
Recent Rental Unit Listings (100)
| Address | Rent (per week) | Bedrooms | Bathrooms | Garage spaces | Date |
|---|---|---|---|---|---|
| Unit 16, 39 Short St | $460 | 2.0 | 1.0 | 1.0 | 15 Apr 2025 |
| Unit 8, 128 Little St | $465 | 2.0 | 1.0 | 1.0 | 11 Apr 2025 |
| Unit 10, 128-130 Little St | $560 | 2.0 | 1.0 | 1.0 | 11 Apr 2025 |
| Unit 10, 128-130 Little St | $560 | 2.0 | 1.0 | 1.0 | 11 Apr 2025 |
| Unit 10, 128-130 Little St | $560 | 2.0 | 1.0 | 1.0 | 11 Apr 2025 |
Recent Rental House Listings (100)
| Address | Rent (per week) | Bedrooms | Bathrooms | Garage spaces | Date | Subdivisible into |
|---|---|---|---|---|---|---|
| 9 Paradise Ave | $675 | 4 | 2 | 3 | 16 Apr 2025 | 0 |
| 22 Morilla Pl | $690 | 4 | 2 | 2 | 10 Apr 2025 | 0 |
| 22 Morilla Pl | $690 | 4 | 2 | 2 | 10 Apr 2025 | 0 |
| 9 Kiola Pl | $650 | 4 | 2 | 2 | 08 Apr 2025 | 0 |
| 26 Cocos Cr | $650 | 3 | 1 | 2 | 03 Apr 2025 | 0 |
Recently Sold Units (100)
| Address | Price | Bedrooms | Bathrooms | Garage spaces | Date sold | Sale Type |
|---|---|---|---|---|---|---|
| Unit 9, 9-11 Reserve Rd | $620,000 | 2.0 | 2.0 | 2.0 | 14 Apr 2025 | On Market |
| Unit 1, 35-37 Head St | $550,000 | 2.0 | 1.0 | 1.0 | 14 Apr 2025 | On Market |
| Unit 1, 35-37 Head St | $550,000 | 2.0 | 1.0 | 1.0 | 14 Apr 2025 | On Market |
| 9 Surfriders Prom | Price Withheld | 3.0 | 2.0 | 2.0 | 09 Apr 2025 | On Market |
| 9 Surfriders Prom | Price Withheld | 3.0 | 2.0 | 2.0 | 09 Apr 2025 | On Market |
Loading entities ..