.png)
Profiles
Nearby Suburbs
Real Estate Market: Is Giru QLD 4809 a Good Suburb to Buy Into?
Housing Market in Giru

Sources: Property Listings and Microburbs, 2002 - 2023
| Field | Value | VS Townsville | Trend | |
|---|---|---|---|---|
| Premium | Premium | Premium | ||
| Premium | Premium | Premium | ||
| Premium | Premium | Premium | ||
| $519 | Bottom 28% |
|
||
| Premium | Premium | Premium |
Housing Supply in Giru

The higher the supply score the more supply is on the market, both current and future.
Sources: ABS, GEOSPATIAL, Property Listings and Microburbs, 2002 - 2023
Sources: ABS, GEOSPATIAL, Property Listings and Microburbs, 2002 - 2023
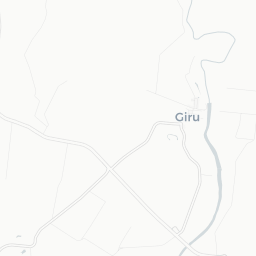
Giru
52.7%
Giru
52.7%
Townsville
35.4%
Townsville
35.4%
| Field | Value | VS Townsville | Trend | |
|---|---|---|---|---|
| 0 | Bottom 38% | Data for Jun 2025 | ||
| 2.0 | Bottom 41% | Data for Jul 2023 | ||
| Premium | Premium | Premium | ||
| Premium | Premium | Premium | ||
| Premium | Premium | Premium | ||
| Premium | Premium | Premium | ||
| Premium | Premium | Premium | ||
| 1 | Top 44% |
|
Housing Stock Quality in Giru
The higher the score, the higher the quality of the houses and units.
Sources: ABS, GEOSPATIAL, Property Listings and Microburbs, 2006 - 2023
Sources: ABS, GEOSPATIAL, Property Listings and Microburbs, 2006 - 2023
| Field | Value | VS Townsville | Trend | |
|---|---|---|---|---|
| 96.8% | Bottom 31% |
|
||
| 2.2 | Bottom 26% |
|
||
| 0.0% | Bottom 37% | Data for Jun 2023 |
Development Restrictions in Giru

The higher the score, the more easily density can be increased.
Sources: GEOSPATIAL, TORREN, ABS and Microburbs, 2011 - 2023
Sources: GEOSPATIAL, TORREN, ABS and Microburbs, 2011 - 2023
Giru
33.1%
Giru
33.1%
Townsville
38.1%
Townsville
38.1%
| Field | Value | VS Townsville | Trend | |
|---|---|---|---|---|
| 14.0 sq km | Top 40% | Data for Jan 2021 | ||
| 0.0 sq km | Bottom 39% | Data for Jun 2023 | ||
| 792 sqm per resident | Bottom 40% | Data for Jan 2021 |
Risk in Giru

The higher the score, the more exposed households are to financial stress.
Sources: ABS, Property Listings, TORREN and Microburbs, 2006 - 2023
Sources: ABS, Property Listings, TORREN and Microburbs, 2006 - 2023
Giru
51.0%
Giru
51.0%
Townsville
67.4%
Townsville
67.4%
| Field | Value | VS Townsville | Trend | |
|---|---|---|---|---|
| 95.0% | Top 38% |
|
||
| 5.0% | Bottom 38% |
|
||
| 22 | Bottom 15% | Data for Jun 2023 | ||
| $1,150 | Bottom 14% |
|
||
| 81 | Top 35% | Data for Jun 2023 | ||
| 74 | Bottom 36% | Data for Jun 2023 | ||
| 17.4% | Bottom 27% |
|
||
| 28.3% | Bottom 21% |
|
Housing Demand in Giru
The higher the score, the more demand their is for housing in the area, both current and future.
Sources: ABS, TORREN, Property Listings and Microburbs, 2006 - 2030
Sources: ABS, TORREN, Property Listings and Microburbs, 2006 - 2030
Giru
30.0%
Giru
30.0%
Townsville
62.0%
Townsville
62.0%
| Field | Value | VS Townsville | Trend | |
|---|---|---|---|---|
| Premium | Premium | Premium | ||
| Premium | Premium | Premium | ||
| 5780 | Bottom 28% |
|
||
| 42300 | Bottom 27% |
|
||
| Premium | Premium | Premium | ||
| 16300 | Top 46% |
|
||
| Premium | Premium | Premium | ||
| Premium | Premium | Premium | ||
| Premium | Premium | Premium |
Unit Market in Giru
Sources: Property Listings and Microburbs, 2002 - 2023
| Field | Value | VS Townsville | Trend | |
|---|---|---|---|---|
| Premium | Premium | Premium | ||
| $430 | Bottom 32% |
|
||
| Premium | Premium | Premium | ||
| 74.4% | Top 45% |
|
Businesses (1)
| Name | Address |
|---|---|
| Townsville Water Bores | Townsville |
Planning Applications: Other (1)
| Headline | Place | Date |
|---|---|---|
| Material Change of Use for Home Occupation (Nursery) - Burdekin Shire Council CONS16/0003 | 221 Hodel Road, Giru, QLD | 26 Feb 2016 |
Turnover Rate by Street (19)
| Turnover rate | Street | Turnover Label | Turnover Years | Year |
|---|---|---|---|---|
| 50.0% | Lyons Rd | very tightly held | Every 20.0 years (very tightly held) | 2025 |
| 56.2% | Shirbourne Rd | quite tightly held | Every 17.8 years (quite tightly held) | 2025 |
| 46.7% | Barbat St | very tightly held | Every 21.4 years (very tightly held) | 2025 |
| 76.7% | Donaghue St | average turnover | Every 13.0 years (average turnover) | 2025 |
| 93.5% | Hodel Rd | high turnover | Every 10.7 years (high turnover) | 2025 |
Percent of Renters by Street (24)
| Percent of Renters | Street |
|---|---|
| 18.7% | Barbat St |
| 0.0% | Bird St |
| 45.9% | Blee St |
| 9.9% | Brookes St |
| 0.0% | Bruce Hwy |
LGA Details (1)
| Headline | Place | Datetime |
|---|---|---|
| Local government area | Burdekin |
Recently Sold Houses (61)
| Address | Price | Bedrooms | Bathrooms | Garage spaces | Date sold | Subdivisible into | Sale Type |
|---|---|---|---|---|---|---|---|
| 42 Donaghue St | $150,000 | 3.0 | 1.0 | 2.0 | 13 Sep 2024 | 0 | On Market |
| 22 Lyons St | $272,000 | 3.0 | 1.0 | 3.0 | 22 Jun 2024 | 0 | On Market |
| 6 Mill St | $145,000 | 3.0 | 1.0 | 0.0 | 18 Jun 2024 | 0 | On Market |
| 9 Brookes St | $170,000 | 3.0 | 1.0 | 1.0 | 17 Jun 2024 | 0 | On Market |
| 24 Church St | $230,000 | 3.0 | 1.0 | 4.0 | 27 Mar 2024 | 0 | On Market |
Median House Sale Prices by Street (100)
| Street | Date | Median sale value |
|---|---|---|
| Donaghue St | 10 May 2024 | $180,000 |
| Brookes St | 10 May 2024 | $177,500 |
| Church St | 10 May 2024 | $254,500 |
| Lyons St | 06 Oct 2023 | $155,700 |
| Mill St | 06 Oct 2023 | $236,700 |
Recent Rental House Listings (100)
| Address | Rent (per week) | Bedrooms | Bathrooms | Garage spaces | Date | Subdivisible into |
|---|---|---|---|---|---|---|
| 12 Barbat St | Price Withheld | 3 | 1 | 4 | 15 Feb 2021 | 0 |
| 12 Barbat St | Price Withheld | 3 | 1 | 4 | 15 Feb 2021 | 0 |
| 12 Barbat St | Price Withheld | 3 | 1 | 4 | 15 Feb 2021 | 0 |
| 12 Barbat St | Price Withheld | 3 | 1 | 4 | 15 Feb 2021 | 0 |
| 12 Barbat St | Price Withheld | 3 | 1 | 4 | 15 Feb 2021 | 0 |
Recent Rental Unit Listings (1)
| Address | Rent (per week) | Bedrooms | Bathrooms | Garage spaces | Date |
|---|---|---|---|---|---|
| 2/8 Brookes St | $140 | Unknown | Unknown | Unknown | 09 Jul 2015 |
Recently Sold Units (100)
| Address | Price | Bedrooms | Bathrooms | Garage spaces | Date sold | Sale Type |
|---|---|---|---|---|---|---|
| 16 Donaghue St | $125,000 | 0.0 | 0.0 | 0.0 | 12 Apr 2024 | On Market |
| 16 Donaghue St | $125,000 | 0.0 | 0.0 | 0.0 | 12 Apr 2024 | On Market |
| 16 Donaghue St | $125,000 | 0.0 | 0.0 | 0.0 | 12 Apr 2024 | On Market |
| 16 Donaghue St | $125,000 | 0.0 | 0.0 | 0.0 | 12 Apr 2024 | On Market |
| 16 Donaghue St | $125,000 | 0.0 | 0.0 | 0.0 | 12 Apr 2024 | On Market |
Loading entities ..