.png)
Profiles
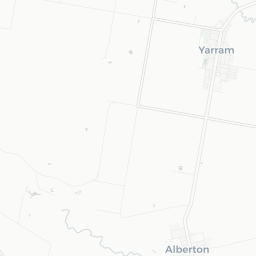
Nearby Suburbs
Real Estate Market: Is Hiawatha VIC 3971 a Good Suburb to Buy Into?
Housing Market in Hiawatha

Sources: Property Listings and Microburbs, 2002 - 2023
| Field | Value | VS Latrobe | Trend | |
|---|---|---|---|---|
| Premium | Premium | Premium | ||
| Premium | Premium | Premium | ||
| Premium | Premium | Premium | ||
| $495 | Bottom 18% |
|
||
| Premium | Premium | Premium |
Housing Supply in Hiawatha

The higher the supply score the more supply is on the market, both current and future.
Sources: ABS, GEOSPATIAL, Property Listings, PLANNING ALERTS and Microburbs, 2002 - 2023
Sources: ABS, GEOSPATIAL, Property Listings, PLANNING ALERTS and Microburbs, 2002 - 2023
Hiawatha
56.0%
Hiawatha
56.0%
Latrobe
33.6%
Latrobe
33.6%
| Field | Value | VS Latrobe | Trend | |
|---|---|---|---|---|
| 0 | Bottom 38% | Data for Jun 2025 | ||
| 22.0 | Top 9% | Data for Jul 2023 | ||
| Premium | Premium | Premium | ||
| Premium | Premium | Premium | ||
| 2 lots | Bottom 13% | Data for Aug 2022 | ||
| Premium | Premium | Premium | ||
| Premium | Premium | Premium |
Housing Stock Quality in Hiawatha
The higher the score, the higher the quality of the houses and units.
Sources: ABS, GEOSPATIAL, Property Listings and Microburbs, 2006 - 2023
Sources: ABS, GEOSPATIAL, Property Listings and Microburbs, 2006 - 2023
| Field | Value | VS Latrobe | Trend | |
|---|---|---|---|---|
| 100.0% | Top 31% | Data for Jan 2021 | ||
| 1.6 | Bottom 6% |
|
||
| 0.0% | Bottom 37% | Data for Jun 2023 |
Development Restrictions in Hiawatha

The higher the score, the more easily density can be increased.
Sources: GEOSPATIAL, TORREN and Microburbs, 2011 - 2023
Sources: GEOSPATIAL, TORREN and Microburbs, 2011 - 2023
Hiawatha
21.8%
Hiawatha
21.8%
Latrobe
30.6%
Latrobe
30.6%
| Field | Value | VS Latrobe | Trend | |
|---|---|---|---|---|
| 0.0 sq km | Bottom 37% | Data for Jun 2023 |
Risk in Hiawatha

The higher the score, the more exposed households are to financial stress.
Sources: ABS, Property Listings, TORREN and Microburbs, 2006 - 2023
Sources: ABS, Property Listings, TORREN and Microburbs, 2006 - 2023
Hiawatha
31.0
Hiawatha
31.0
Latrobe
36.1
Latrobe
36.1
| Field | Value | VS Latrobe | Trend | |
|---|---|---|---|---|
| 40 | Top 29% | Data for Jun 2023 | ||
| 77 | Bottom 44% | Data for Jun 2023 | ||
| 72 | Bottom 28% | Data for Jun 2023 | ||
| 44.7% | Top 3% |
|
Housing Demand in Hiawatha
The higher the score, the more demand their is for housing in the area, both current and future.
Sources: ABS, TORREN, Property Listings and Microburbs, 2006 - 2030
Sources: ABS, TORREN, Property Listings and Microburbs, 2006 - 2030
Hiawatha
53.9%
Hiawatha
53.9%
Latrobe
55.8%
Latrobe
55.8%
| Field | Value | VS Latrobe | Trend | |
|---|---|---|---|---|
| Premium | Premium | Premium | ||
| Premium | Premium | Premium | ||
| 5980 | Bottom 20% |
|
||
| 46000 | Bottom 30% |
|
||
| Premium | Premium | Premium | ||
| 46000 | Top 28% |
|
||
| Premium | Premium | Premium |
Unit Market in Hiawatha
Sources: Property Listings and Microburbs, 2002 - 2023
| Field | Value | VS Latrobe | Trend | |
|---|---|---|---|---|
| Premium | Premium | Premium | ||
| 166.0% | Top 1% |
|
LGA Details (1)
| Headline | Place | Datetime |
|---|---|---|
| Local government area | Wellington |
Percent of Renters by Street (3)
| Percent of Renters | Street |
|---|---|
| 0.0% | Christies-Albert River Rd |
| 0.0% | Albert River Rd |
| 0.0% | Dessents Rd |
Turnover Rate by Street (2)
| Turnover rate | Street | Turnover Label | Turnover Years | Year |
|---|---|---|---|---|
| 100.0% | Dessents Rd | high turnover | Every 10.0 years (high turnover) | 2025 |
| 100.0% | Christies-Albert River Rd | high turnover | Every 10.0 years (high turnover) | 2025 |
Recently Sold Houses (3)
| Address | Price | Bedrooms | Bathrooms | Garage spaces | Date sold | Subdivisible into | Sale Type |
|---|---|---|---|---|---|---|---|
| 319 Christies-albert River Rd | $319,000 | 2.0 | 2.0 | 08 Dec 2017 | 0 | On Market | |
| 1321 Albert River Rd | $390,000 | 4.0 | 1.0 | 0.0 | 10 Sep 2014 | 0 | On Market |
| 1321 Albert River Rd | $390,000 | 4.0 | 1.0 | 0.0 | 10 Sep 2014 | 0 | On Market |
Loading entities ..