.png)
Profiles
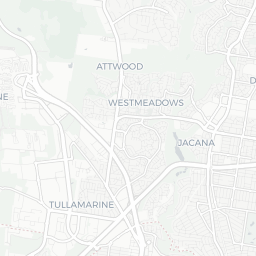
Nearby Suburbs
Real Estate Market: Is Jacana VIC 3047 a Good Suburb to Buy Into?
Housing Market in Jacana

Sources: Property Listings and Microburbs, 2002 - 2023
| Field | Value | VS Melbourne | Trend | |
|---|---|---|---|---|
| Premium | Premium | Premium | ||
| Premium | Premium | Premium | ||
| Premium | Premium | Premium | ||
| $551 | Bottom 40% |
|
||
| Premium | Premium | Premium |
Housing Supply in Jacana

The higher the supply score the more supply is on the market, both current and future.
Sources: ABS, GEOSPATIAL, Property Listings, PLANNING ALERTS and Microburbs, 2002 - 2023
Sources: ABS, GEOSPATIAL, Property Listings, PLANNING ALERTS and Microburbs, 2002 - 2023
Jacana
34.0%
Jacana
34.0%
Melbourne
28.8%
Melbourne
28.8%
| Field | Value | VS Melbourne | Trend | |
|---|---|---|---|---|
| 249 | Top 13% |
|
||
| 2.1 | Bottom 48% | Data for Jul 2023 | ||
| 40.2 | Top 17% | Data for May 2023 | ||
| Premium | Premium | Premium | ||
| Premium | Premium | Premium | ||
| Premium | Premium | Premium | ||
| 12 lots | Top 36% |
|
||
| Premium | Premium | Premium | ||
| Premium | Premium | Premium | ||
| 6 | Top 21% |
|
Housing Stock Quality in Jacana
The higher the score, the higher the quality of the houses and units.
Sources: ABS, GEOSPATIAL, Property Listings and Microburbs, 2006 - 2023
Sources: ABS, GEOSPATIAL, Property Listings and Microburbs, 2006 - 2023
| Field | Value | VS Melbourne | Trend | |
|---|---|---|---|---|
| 81.9% | Bottom 14% |
|
||
| 2.6 | Top 39% |
|
||
| 0.0% | Bottom 37% | Data for Jun 2023 |
Development Restrictions in Jacana

The higher the score, the more easily density can be increased.
Sources: GEOSPATIAL, TORREN, ABS and Microburbs, 2011 - 2023
Sources: GEOSPATIAL, TORREN, ABS and Microburbs, 2011 - 2023
Jacana
26.8%
Jacana
26.8%
Melbourne
36.9%
Melbourne
36.9%
| Field | Value | VS Melbourne | Trend | |
|---|---|---|---|---|
| 0.9 sq km | Bottom 8% | Data for Jan 2021 | ||
| 0.0 sq km | Bottom 18% | Data for Jun 2023 | ||
| 388 sqm per resident | Bottom 19% | Data for Jan 2021 |
Risk in Jacana

The higher the score, the more exposed households are to financial stress.
Sources: ABS, Property Listings, TORREN and Microburbs, 2006 - 2023
Sources: ABS, Property Listings, TORREN and Microburbs, 2006 - 2023
Jacana
62.8%
Jacana
62.8%
Melbourne
60.4%
Melbourne
60.4%
| Field | Value | VS Melbourne | Trend | |
|---|---|---|---|---|
| 75.0% | Bottom 10% |
|
||
| 25.0% | Top 10% |
|
||
| 49 | Top 14% | Data for Jun 2023 | ||
| $1,470 | Bottom 26% |
|
||
| 72 | Bottom 18% | Data for Jun 2023 | ||
| 57 | Bottom 3% | Data for Jun 2023 | ||
| 25.1% | Top 34% |
|
||
| 34.7% | Bottom 39% |
|
Housing Demand in Jacana
The higher the score, the more demand their is for housing in the area, both current and future.
Sources: ABS, TORREN, Property Listings and Microburbs, 1975 - 2030
Sources: ABS, TORREN, Property Listings and Microburbs, 1975 - 2030
Jacana
79.0%
Jacana
79.0%
Melbourne
82.9%
Melbourne
82.9%
| Field | Value | VS Melbourne | Trend | |
|---|---|---|---|---|
| Premium | Premium | Premium | ||
| Premium | Premium | Premium | ||
| 21200 | Top 16% |
|
||
| 221000 | Top 2% |
|
||
| Premium | Premium | Premium | ||
| 324000 | Top 2% |
|
||
| Premium | Premium | Premium | ||
| Premium | Premium | Premium | ||
| Premium | Premium | Premium | ||
| Premium | Premium | Premium |
Unit Market in Jacana
Sources: Property Listings and Microburbs, 2002 - 2023
| Field | Value | VS Melbourne | Trend | |
|---|---|---|---|---|
| Premium | Premium | Premium | ||
| $531 | Top 37% |
|
||
| Premium | Premium | Premium | ||
| 87.3% | Top 21% |
|
Planning Applications: Dwellings (33)
| Headline | Place | Date |
|---|---|---|
| Development of the land for a second dwelling in the melbourne airport environs overlay - Hume City Council P26480 | 24 Landy Rd Jacana VIC 3047 | 03 Feb 2025 |
| Three Lot Subdivision Please also include an option to complete this development prior to construction using a Section 173 Agreement or similar. - Streamlined Planning through Electronic Applications and Referrals S240826A | 147 Langton Street, Jacana VIC 3047 | 30 Nov 2024 |
| 7 lot vicsmart subdivision. The occupancy permit - Streamlined Planning through Electronic Applications and Referrals S236648P | 1 Sunset Boulevard, Jacana VIC 3047 | 13 Sep 2024 |
| Development of the land for a dwelling in a melbourne airport environs overlay - Hume City Council P26075 | 149 Langton St Jacana VIC 3047 | 26 Jun 2024 |
| Development of the land for a second dwelling in the melbourne airport environs overlay - Hume City Council P26059 | 70 Sunset Bvd Jacana VIC 3047 | 18 Jun 2024 |
Planning Applications: Other (11)
| Headline | Place | Date |
|---|---|---|
| Development of the land for a cafe with outdoor eating area and associated red line liquor area - Hume City Council P26304 | 24 Emu Pde Jacana VIC 3047 | 22 Oct 2024 |
| Development of the land for a cafe with outdoor eating area and associated red line liquor area - Hume City Council P26304 | 24 Emu Pde Jacana VIC 3047 | 22 Oct 2024 |
| Development of land for addition & alterations within a maeo & pao - Hume City Council P25552 | 1033 Pascoe Vale Rd Jacana VIC 3047 | 28 Sep 2023 |
| Use and development of a community care accommodation in maeo 2 - Hume City Council P25163 | 7 Fidge Ct Jacana VIC 3047 | 28 Mar 2023 |
| Installation of (four) light poles around the bowling green - Hume City Council P25146 | 111 Sunset Bvd Jacana VIC 3047 | 15 Mar 2023 |
Businesses (13)
| Name | Address |
|---|---|
| Slabs Concreter Melbourne - Concreting & Excavation, Paving Broadmeadows-Jacana | 981 Pascoe Vale Rd, Jacana VIC 3047, Australia |
| Electricians Jacana | Emergency 24 Hour Electrician, Jacana VIC 3047, Australia |
| Express Bobcat Hire Melbourne - Earthmoving | Asbestos Removal Melbourne CBD | 60 Bliburg St, Jacana VIC 3047, Australia |
| Yas Fencing | |
| Express Bin Hire |
Accommodation Options (1)
| Name | Address |
|---|---|
| Broadmeadows Hospital | 35 Johnstone St, Jacana VIC 3047, Australia |
Median House Rental Prices by Street (13)
| Street | Date | Median rent (per week) |
|---|---|---|
| Emu Pde | 22 Mar 2025 | $500 |
| Hales Cr | 22 Mar 2025 | $500 |
| Bliburg St | 22 Mar 2025 | $530 |
| Bamburgh St | 22 Mar 2025 | $525 |
| Sunset Bvd | 22 Mar 2025 | $530 |
Median Unit Sale Prices by Street (100)
| Date | Median sale value | Street |
|---|---|---|
| 10 May 2024 | $389,000 | Pascoe Vale Rd |
| 06 Oct 2023 | $397,500 | Bamburgh St |
| 06 Oct 2023 | $453,400 | Langton St |
| 06 Oct 2023 | $445,400 | Lichfield Ave |
| 06 Oct 2023 | $459,100 | Biltris Ct |
LGA Details (1)
| Headline | Place | Datetime |
|---|---|---|
| Local government area | Hume |
Turnover Rate by Street (25)
| Turnover rate | Street | Turnover Label | Turnover Years | Year |
|---|---|---|---|---|
| 65.2% | Fox Ct | quite tightly held | Every 15.3 years (quite tightly held) | 2025 |
| 57.1% | Landy Rd | quite tightly held | Every 17.5 years (quite tightly held) | 2025 |
| 105.2% | Sunset Bvd | high turnover | Every 9.5 years (high turnover) | 2025 |
| 82.1% | Freeland Gr | average turnover | Every 12.2 years (average turnover) | 2025 |
| 123.1% | Bessell Ct | very high turnover | Every 8.1 years (very high turnover) | 2025 |
Recently Sold Houses (100)
| Address | Price | Bedrooms | Bathrooms | Garage spaces | Date sold | Subdivisible into | Sale Type |
|---|---|---|---|---|---|---|---|
| 5 Bamburgh St | $630,000 | 3.0 | 1.0 | 2.0 | 01 Mar 2025 | 0 | On Market |
| 50 Emu Pde | $640,000 | 3.0 | 1.0 | 2.0 | 01 Mar 2025 | 0 | On Market |
| 35 Freeland Gr | $790,000 | 2.0 | 2.0 | 4.0 | 22 Feb 2025 | 0 | On Market |
| 82 Sunset Bvd | $535,000 | 3.0 | 1.0 | 21 Feb 2025 | 0 | On Market | |
| 82 Sunset Bvd | $535,000 | 3.0 | 1.0 | 2.0 | 21 Feb 2025 | 0 | On Market |
Percent of Renters by Street (26)
| Percent of Renters | Street |
|---|---|
| 32.8% | Bamburgh St |
| 34.8% | Bates Ct |
| 38.8% | Bannister St |
| 46.7% | Bessell Ct |
| 44.5% | Bliburg St |
Median House Sale Prices by Street (100)
| Street | Date | Median sale value |
|---|---|---|
| Rose Ct | 06 Oct 2023 | $860,000 |
| Langton St | 25 Apr 2024 | $535,000 |
| Robinson St | 10 May 2024 | $467,500 |
| Sunset Bvd | 10 May 2024 | $595,000 |
| Emu Pde | 10 May 2024 | $471,000 |
Recent Rental Unit Listings (100)
| Address | Rent (per week) | Bedrooms | Bathrooms | Garage spaces | Date |
|---|---|---|---|---|---|
| Unit 2, 3 Biltris Ct | Price Withheld | 2.0 | 1.0 | 1.0 | 21 Feb 2023 |
| Unit 2, 3 Biltris Ct | Price Withheld | 2.0 | 1.0 | 1.0 | 21 Feb 2023 |
| Unit 2, 3 Biltris Ct | Price Withheld | 2.0 | 1.0 | 1.0 | 21 Feb 2023 |
| Unit 2, 3 Biltris Ct | Price Withheld | 2.0 | 1.0 | 1.0 | 21 Feb 2023 |
| Unit 2, 3 Biltris Ct | Price Withheld | 2.0 | 1.0 | 1.0 | 21 Feb 2023 |
Recent Rental House Listings (100)
| Address | Rent (per week) | Bedrooms | Bathrooms | Garage spaces | Date | Subdivisible into |
|---|---|---|---|---|---|---|
| 60 Emu Pde | $490 | 3 | 1 | 0 | 04 Mar 2025 | 0 |
| 60 Emu Pde | $490 | 3 | 1 | 0 | 04 Mar 2025 | 0 |
| 60 Emu Pde | $520 | 3 | 1 | 0 | 04 Mar 2025 | 0 |
| 60 Emu Pde | $490 | 3 | 1 | 0 | 04 Mar 2025 | 0 |
| 72 Lorraine Cr | $500 | 3 | 1 | 2 | 04 Mar 2025 | 0 |
Recently Sold Units (100)
| Address | Price | Bedrooms | Bathrooms | Garage spaces | Date sold | Sale Type |
|---|---|---|---|---|---|---|
| Unit 4, 8 Fidge Ct | $495,000 | 2.0 | 2.0 | 1.0 | 13 Mar 2025 | On Market |
| Unit 4, 8 Fidge Ct | $495,000 | 2.0 | 2.0 | 1.0 | 13 Mar 2025 | On Market |
| Unit 4, 8 Fidge Ct | $495,000 | 2.0 | 2.0 | 1.0 | 13 Mar 2025 | On Market |
| Unit 2, 66 Sunset Bvd | $530,000 | 3.0 | 1.0 | 2.0 | 13 Nov 2024 | On Market |
| Unit 2, 66 Sunset Bvd | $530,000 | 3.0 | 1.0 | 2.0 | 13 Nov 2024 | On Market |
Loading entities ..