.png)
Profiles
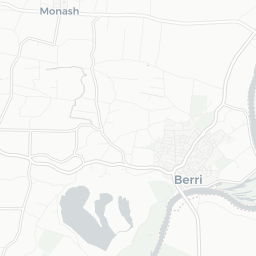
Nearby Suburbs
Real Estate Market: Is Loveday SA 5345 a Good Suburb to Buy Into?
Housing Market in Loveday

Sources: Property Listings and Microburbs, 2002 - 2023
| Field | Value | VS Regional SA | Trend | |
|---|---|---|---|---|
| Premium | Premium | Premium | ||
| Premium | Premium | Premium | ||
| Premium | Premium | Premium | ||
| $384 | Bottom 0% |
|
||
| Premium | Premium | Premium |
Housing Supply in Loveday

The higher the supply score the more supply is on the market, both current and future.
Sources: ABS, GEOSPATIAL, Property Listings, PLANNING ALERTS, BASIX and Microburbs, 2002 - 2023
Sources: ABS, GEOSPATIAL, Property Listings, PLANNING ALERTS, BASIX and Microburbs, 2002 - 2023
Loveday
43.5%
Loveday
43.5%
Regional SA
46.5%
Regional SA
46.5%
| Field | Value | VS Regional SA | Trend | |
|---|---|---|---|---|
| 0 | Bottom 38% |
|
||
| 0.0 | Bottom 10% | Data for Jul 2023 | ||
| Premium | Premium | Premium | ||
| Premium | Premium | Premium | ||
| Premium | Premium | Premium | ||
| 4 | Bottom 13% | Data for Dec 2018 | ||
| 3 lots | Bottom 32% | Data for Feb 2021 | ||
| Premium | Premium | Premium | ||
| Premium | Premium | Premium |
Housing Stock Quality in Loveday
The higher the score, the higher the quality of the houses and units.
Sources: ABS, GEOSPATIAL, Property Listings, BASIX and Microburbs, 2006 - 2023
Sources: ABS, GEOSPATIAL, Property Listings, BASIX and Microburbs, 2006 - 2023
| Field | Value | VS Regional SA | Trend | |
|---|---|---|---|---|
| 100.0% | Top 31% | Data for Jan 2021 | ||
| 2.5 | Top 48% |
|
||
| 0.0% | Bottom 37% | Data for Jun 2023 |
Development Restrictions in Loveday

The higher the score, the more easily density can be increased.
Sources: GEOSPATIAL, ABS and Microburbs, 2011 - 2023
Sources: GEOSPATIAL, ABS and Microburbs, 2011 - 2023
Loveday
27.2%
Loveday
27.2%
Regional SA
27.5%
Regional SA
27.5%
| Field | Value | VS Regional SA | Trend | |
|---|---|---|---|---|
| 90.0 sq km | Top 12% | Data for Jan 2021 | ||
| 234 sqm per resident | Bottom 5% | Data for Jan 2021 |
Risk in Loveday

The higher the score, the more exposed households are to financial stress.
Sources: ABS, Property Listings and Microburbs, 2006 - 2023
Sources: ABS, Property Listings and Microburbs, 2006 - 2023
Loveday
36.0%
Loveday
36.0%
Regional SA
48.8%
Regional SA
48.8%
| Field | Value | VS Regional SA | Trend | |
|---|---|---|---|---|
| 96.3% | Top 32% |
|
||
| 3.8% | Bottom 32% |
|
||
| 22 | Bottom 14% | Data for Jun 2023 | ||
| $1,710 | Bottom 37% |
|
||
| 83 | Top 19% | Data for Jun 2023 | ||
| 84 | Top 6% | Data for Jun 2023 | ||
| 18.1% | Bottom 29% |
|
||
| 50.1% | Top 21% |
|
Housing Demand in Loveday
The higher the score, the more demand their is for housing in the area, both current and future.
Sources: ABS, TORREN, Property Listings and Microburbs, 2006 - 2030
Sources: ABS, TORREN, Property Listings and Microburbs, 2006 - 2030
Loveday
34.0%
Loveday
34.0%
Regional SA
37.0%
Regional SA
37.0%
| Field | Value | VS Regional SA | Trend | |
|---|---|---|---|---|
| 6690 | Bottom 26% |
|
||
| 73800 | Top 42% |
|
||
| Premium | Premium | Premium | ||
| 10700 | Bottom 46% |
|
||
| Premium | Premium | Premium | ||
| Premium | Premium | Premium |
Unit Market in Loveday
Sources: Property Listings and Microburbs, 2002 - 2023
| Field | Value | VS Regional SA | Trend | |
|---|---|---|---|---|
| Premium | Premium | Premium | ||
| $268 | Bottom 0% |
|
||
| Premium | Premium | Premium | ||
| 69.7% | Bottom 40% |
|
LGA Details (1)
| Headline | Place | Datetime |
|---|---|---|
| Local government area | Berri Barmera |
Percent of Renters by Street (27)
| Percent of Renters | Street |
|---|---|
| 0.0% | Anderson Rd |
| 0.0% | Bassham Rd |
| 0.0% | Caddy Rd |
| 0.0% | Coates Rd |
| 0.0% | Costello Rd |
Turnover Rate by Street (26)
| Turnover rate | Street | Turnover Label | Turnover Years | Year |
|---|---|---|---|---|
| 75.0% | Yeo Rd | average turnover | Every 13.3 years (average turnover) | 2025 |
| 66.7% | Morris St | quite tightly held | Every 15.0 years (quite tightly held) | 2025 |
| 73.3% | Loveday Rd | average turnover | Every 13.6 years (average turnover) | 2025 |
| 100.0% | Renfrey Rd | high turnover | Every 10.0 years (high turnover) | 2025 |
| 100.0% | Stockdale Rd | high turnover | Every 10.0 years (high turnover) | 2025 |
Recently Sold Houses (56)
| Address | Price | Bedrooms | Bathrooms | Garage spaces | Date sold | Subdivisible into | Sale Type |
|---|---|---|---|---|---|---|---|
| 43 Anderson Rd | $325,000 | 2.0 | 1.0 | 5.0 | 11 Mar 2025 | 0 | On Market |
| 284 Caddy Rd | $365,000 | 3.0 | 1.0 | 16 Dec 2024 | 0 | On Market | |
| 284 Caddy Rd | $365,000 | 3.0 | 1.0 | 2.0 | 28 Oct 2024 | 0 | On Market |
| 296 Mckenzie Rd | $280,000 | 3.0 | 1.0 | 2.0 | 06 Sep 2024 | 0 | On Market |
| 55 Stockdale Rd | $660,000 | 3.0 | 1.0 | 3.0 | 22 Aug 2024 | 0 | On Market |
Planning Applications: Other (7)
| Headline | Place | Date |
|---|---|---|
| 4.95 MW (AC) renewable solar energy facility, with associated battery storage units, inverter station and fencing - variation of prior approval 752.132.18 - South Australia Planning Portal 22014001 | 329 Loveday Rd Loveday SA 5345 | 09 May 2022 |
| 19.98kW Ground Mounted Solar Farm Installation associated with CIT pump station. - South Australia Planning Portal 22009299 | Lot 1017 Loveday Rd Loveday SA 5345 | 20 Mar 2022 |
| Agricultural building. - South Australia Planning Portal 22001333 | 184 Costello Rd Loveday SA 5345 | 23 Feb 2022 |
| Woodland grey roof and trim framework to be all galv carport - South Australia Planning Portal 21037543 | 286 Gordon Rd Loveday SA 5345 | 21 Nov 2021 |
| Boundary realignment (no additional allotments) - South Australia Planning Portal 21020093 | 385 Hunt Rd Loveday SA 5345 | 20 Jul 2021 |
Planning Applications: Dwellings (3)
| Headline | Place | Date |
|---|---|---|
| Replacement Dwelling - South Australia Planning Portal 21025755 | 332 Costello Rd Loveday SA 5345 | 12 Oct 2021 |
| Verandah (30m2) attached to the side of the existing dwelling - South Australia Planning Portal 21020461 | 774 Hunt Rd Loveday SA 5345 | 25 Jul 2021 |
| Land Division - Subdivision of one existing allotment into three allotments for residential purposes. - South Australia Planning Portal 752/D405/21 | 845 Hunt Rd Loveday SA 5345, SA | 10 Feb 2021 |
Median Unit Sale Prices by Street (1)
| Date | Median sale value | Street |
|---|---|---|
| 10 Apr 2024 | $315,000 | Gilmour Rd |
Median House Sale Prices by Street (100)
| Street | Date | Median sale value |
|---|---|---|
| Thiele Rd | 10 May 2024 | $412,500 |
| Caddy Rd | 31 May 2024 | 346000.0 |
| Costello Rd | 31 May 2024 | 301000.0 |
| Forward Ave | 31 May 2024 | 582800.0 |
| Hoffman Rd | 31 May 2024 | 271200.0 |
Recent Rental House Listings (100)
| Address | Rent (per week) | Bedrooms | Bathrooms | Garage spaces | Date | Subdivisible into |
|---|---|---|---|---|---|---|
| 302 Gilmour Rd | $450 | 3 | 1 | 0 | 24 Jan 2025 | 0 |
| 302 Gilmour Rd | $450 | 3 | 1 | 0 | 24 Jan 2025 | 0 |
| 302 Gilmour Rd | $450 | 3 | 1 | 0 | 24 Jan 2025 | 0 |
| 302 Gilmour Rd | $450 | 3 | 1 | 0 | 24 Jan 2025 | 0 |
| 302 Gilmour Rd | $450 | 3 | 1 | 0 | 24 Jan 2025 | 0 |
Recently Sold Units (100)
| Address | Price | Bedrooms | Bathrooms | Garage spaces | Date sold | Sale Type |
|---|---|---|---|---|---|---|
| 43 Anderson Rd | $325,000 | 2.0 | 1.0 | 5.0 | 11 Mar 2025 | On Market |
| 43 Anderson Rd | $325,000 | 2.0 | 1.0 | 5.0 | 11 Mar 2025 | On Market |
| 43 Anderson Rd | $325,000 | 2.0 | 1.0 | 5.0 | 11 Mar 2025 | On Market |
| 43 Anderson Rd | $325,000 | 2.0 | 1.0 | 5.0 | 11 Mar 2025 | On Market |
| 43 Anderson Rd | $325,000 | 2.0 | 1.0 | 5.0 | 11 Mar 2025 | On Market |
Loading entities ..