.png)
Profiles
Nearby Suburbs
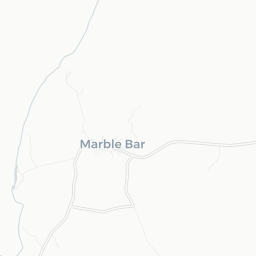
Real Estate Market: Is Marble Bar WA 6760 a Good Suburb to Buy Into?
Housing Market in Marble Bar

Sources: Property Listings and Microburbs, 2002 - 2023
| Field | Value | VS Regional WA | Trend | |
|---|---|---|---|---|
| Premium | Premium | Premium | ||
| Premium | Premium | Premium | ||
| Premium | Premium | Premium | ||
| $938 | Top 8% |
|
||
| Premium | Premium | Premium |
Housing Supply in Marble Bar

The higher the supply score the more supply is on the market, both current and future.
Sources: ABS, GEOSPATIAL, Property Listings and Microburbs, 2002 - 2023
Sources: ABS, GEOSPATIAL, Property Listings and Microburbs, 2002 - 2023
Marble Bar
63.8%
Marble Bar
63.8%
Regional WA
53.5%
Regional WA
53.5%
| Field | Value | VS Regional WA | Trend | |
|---|---|---|---|---|
| 0 | Bottom 38% | Data for Jun 2025 | ||
| 3.6 | Top 37% | Data for Jul 2023 | ||
| Premium | Premium | Premium | ||
| Premium | Premium | Premium | ||
| Premium | Premium | Premium | ||
| Premium | Premium | Premium | ||
| 0 | Bottom 25% | Data for Apr 2025 |
Housing Stock Quality in Marble Bar
The higher the score, the higher the quality of the houses and units.
Sources: ABS, GEOSPATIAL, Property Listings and Microburbs, 2006 - 2023
Sources: ABS, GEOSPATIAL, Property Listings and Microburbs, 2006 - 2023
| Field | Value | VS Regional WA | Trend | |
|---|---|---|---|---|
| 82.2% | Bottom 14% |
|
||
| 2.6 | Top 39% |
|
||
| 0.0% | Bottom 37% | Data for Jun 2023 |
Development Restrictions in Marble Bar

The higher the score, the more easily density can be increased.
Sources: GEOSPATIAL, TORREN, ABS and Microburbs, 2011 - 2023
Sources: GEOSPATIAL, TORREN, ABS and Microburbs, 2011 - 2023
Marble Bar
29.4%
Marble Bar
29.4%
Regional WA
28.5%
Regional WA
28.5%
| Field | Value | VS Regional WA | Trend | |
|---|---|---|---|---|
| 190.0 sq km | Top 5% | Data for Jan 2021 | ||
| 71600 sqm per resident | Top 4% | Data for Jan 2021 |
Risk in Marble Bar

The higher the score, the more exposed households are to financial stress.
Sources: ABS, Property Listings, TORREN and Microburbs, 2006 - 2023
Sources: ABS, Property Listings, TORREN and Microburbs, 2006 - 2023
Marble Bar
9.3
Marble Bar
9.3
Regional WA
31.5
Regional WA
31.5
| Field | Value | VS Regional WA | Trend | |
|---|---|---|---|---|
| 100.0% | Top 11% | Data for May 2023 | ||
| 0.0% | Bottom 11% | Data for May 2023 | ||
| 24 | Bottom 22% | Data for Jun 2023 | ||
| $1,390 | Bottom 23% |
|
||
| 61 | Bottom 2% | Data for Jun 2023 | ||
| 61 | Bottom 5% | Data for Jun 2023 | ||
| 0.0% | Bottom 6% |
|
||
| 0.0% | Bottom 1% | Data for May 2023 |
Housing Demand in Marble Bar
The higher the score, the more demand their is for housing in the area, both current and future.
Sources: ABS, TORREN, Property Listings and Microburbs, 2006 - 2030
Sources: ABS, TORREN, Property Listings and Microburbs, 2006 - 2030
Marble Bar
37.6%
Marble Bar
37.6%
Regional WA
40.5%
Regional WA
40.5%
| Field | Value | VS Regional WA | Trend | |
|---|---|---|---|---|
| Premium | Premium | Premium | ||
| Premium | Premium | Premium | ||
| 6470 | Bottom 22% |
|
||
| 27600 | Bottom 14% |
|
||
| Premium | Premium | Premium | ||
| 10400 | Bottom 44% |
|
||
| Premium | Premium | Premium | ||
| Premium | Premium | Premium | ||
| Premium | Premium | Premium |
LGA Details (1)
| Headline | Place | Datetime |
|---|---|---|
| Local government area | East Pilbara |
Percent of Renters by Street (12)
| Percent of Renters | Street |
|---|---|
| 0.0% | Augusta St |
| 29.2% | Bohemia St |
| 0.0% | Excelsior St |
| 0.0% | Halse Rd |
| 0.0% | Contest St |
Turnover Rate by Street (10)
| Turnover rate | Street | Turnover Label | Turnover Years | Year |
|---|---|---|---|---|
| 50.0% | General St | very tightly held | Every 20.0 years (very tightly held) | 2025 |
| 50.0% | Lynas Rd | very tightly held | Every 20.0 years (very tightly held) | 2025 |
| 11.1% | Bohemia St | very tightly held | Every 90.0 years (very tightly held) | 2025 |
| 35.3% | Francis St | very tightly held | Every 28.3 years (very tightly held) | 2025 |
| 28.6% | Excelsior St | very tightly held | Every 35.0 years (very tightly held) | 2025 |
Recently Sold Houses (11)
| Address | Price | Bedrooms | Bathrooms | Garage spaces | Date sold | Subdivisible into | Sale Type |
|---|---|---|---|---|---|---|---|
| 56 General St | Price Withheld | 3.0 | 1.0 | 03 Mar 2023 | 0 | On Market | |
| 69 General St | $150,000 | 3.0 | 1.0 | 05 Jan 2023 | 0 | On Market | |
| 69 General St | Price Withheld | 3.0 | 1.0 | 0.0 | 05 Jan 2023 | 0 | On Market |
| 81 General St | Price Withheld | 3.0 | 1.0 | 27 Nov 2022 | 0 | On Market | |
| 12 Halse Rd | $230,000 | 4.0 | 2.0 | 2.0 | 04 Sep 2019 | 0 | On Market |
Accommodation Options (1)
| Name | Address |
|---|---|
| Marble Bar Nursing Post | Marble Bar WA 6760, Australia |
Businesses (1)
| Name | Address |
|---|---|
| D J & C M Taylor |
Median House Sale Prices by Street (76)
| Street | Date | Median sale value |
|---|---|---|
| Excelsior St | 30 Jun 2024 | 235300.0 |
| Halse Rd | 06 Oct 2023 | $150,000 |
| General St | 06 Oct 2023 | $150,000 |
| Excelsior St | 30 Jun 2024 | 235300.0 |
| General St | 30 Jun 2024 | 235300.0 |
Loading entities ..