.png)
Profiles
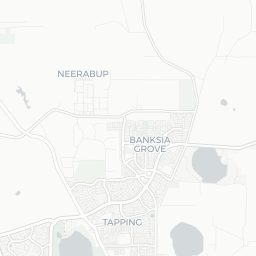
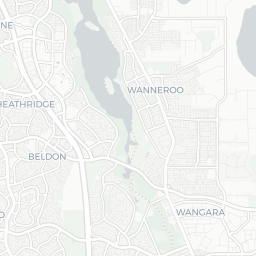
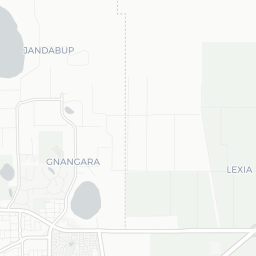
Nearby Suburbs
Real Estate Market: Is Mariginiup WA 6078 a Good Suburb to Buy Into?
Housing Market in Mariginiup

Sources: Property Listings and Microburbs, 2002 - 2023
| Field | Value | VS Perth | Trend | |
|---|---|---|---|---|
| Premium | Premium | Premium | ||
| Premium | Premium | Premium | ||
| Premium | Premium | Premium | ||
| $874 | Top 8% |
|
||
| Premium | Premium | Premium |
Housing Supply in Mariginiup

The higher the supply score the more supply is on the market, both current and future.
Sources: ABS, GEOSPATIAL, Property Listings, PLANNING ALERTS and Microburbs, 2002 - 2023
Sources: ABS, GEOSPATIAL, Property Listings, PLANNING ALERTS and Microburbs, 2002 - 2023
Mariginiup
40.1%
Mariginiup
40.1%
Perth
38.0%
Perth
38.0%
| Field | Value | VS Perth | Trend | |
|---|---|---|---|---|
| 0 | Bottom 38% | Data for Jun 2025 | ||
| 0.0 | Bottom 10% | Data for Jul 2023 | ||
| Premium | Premium | Premium | ||
| Premium | Premium | Premium | ||
| Premium | Premium | Premium | ||
| Premium | Premium | Premium | ||
| Premium | Premium | Premium | ||
| 2 | Top 33% |
|
Housing Stock Quality in Mariginiup
The higher the score, the higher the quality of the houses and units.
Sources: ABS, GEOSPATIAL, Property Listings and Microburbs, 2006 - 2023
Sources: ABS, GEOSPATIAL, Property Listings and Microburbs, 2006 - 2023
| Field | Value | VS Perth | Trend | |
|---|---|---|---|---|
| 98.8% | Bottom 35% |
|
||
| 3.1 | Top 8% |
|
||
| 0.0% | Bottom 37% | Data for Jun 2023 |
Development Restrictions in Mariginiup

The higher the score, the more easily density can be increased.
Sources: GEOSPATIAL, TORREN, ABS and Microburbs, 2011 - 2023
Sources: GEOSPATIAL, TORREN, ABS and Microburbs, 2011 - 2023
Mariginiup
29.3%
Mariginiup
29.3%
Perth
34.5%
Perth
34.5%
| Field | Value | VS Perth | Trend | |
|---|---|---|---|---|
| 2.8 sq km | Bottom 29% | Data for Jan 2021 | ||
| 138 sqm per resident | Bottom 1% | Data for Jan 2021 |
Risk in Mariginiup

The higher the score, the more exposed households are to financial stress.
Sources: ABS, Property Listings, TORREN and Microburbs, 2006 - 2023
Sources: ABS, Property Listings, TORREN and Microburbs, 2006 - 2023
Mariginiup
48.7%
Mariginiup
48.7%
Perth
56.0%
Perth
56.0%
| Field | Value | VS Perth | Trend | |
|---|---|---|---|---|
| 96.3% | Top 32% |
|
||
| 3.7% | Bottom 32% |
|
||
| 29 | Bottom 36% | Data for Jun 2023 | ||
| $2,320 | Top 29% |
|
||
| 78 | Bottom 46% | Data for Jun 2023 | ||
| 76 | Top 49% | Data for Jun 2023 | ||
| 29.1% | Top 18% |
|
||
| 46.8% | Top 28% |
|
Housing Demand in Mariginiup
The higher the score, the more demand their is for housing in the area, both current and future.
Sources: ABS, TORREN, Property Listings and Microburbs, 2006 - 2030
Sources: ABS, TORREN, Property Listings and Microburbs, 2006 - 2030
Mariginiup
71.8%
Mariginiup
71.8%
Perth
71.6%
Perth
71.6%
| Field | Value | VS Perth | Trend | |
|---|---|---|---|---|
| Premium | Premium | Premium | ||
| Premium | Premium | Premium | ||
| 15300 | Top 32% |
|
||
| 229000 | Top 1% |
|
||
| Premium | Premium | Premium | ||
| 291000 | Top 3% |
|
||
| Premium | Premium | Premium | ||
| Premium | Premium | Premium |
Unit Market in Mariginiup
Sources: Property Listings and Microburbs, 2002 - 2023
| Field | Value | VS Perth | Trend | |
|---|---|---|---|---|
| Premium | Premium | Premium | ||
| $465 | Bottom 43% |
|
||
| Premium | Premium | Premium | ||
| 53.0% | Bottom 14% |
|
Businesses (8)
| Name | Address |
|---|---|
| Budo Group | 7 Coogee Rd, Mariginiup WA 6078, Australia |
| Peter Stewart Homes - Double Storey Extensions Perth | 69 Adams Rd, Mariginiup WA 6078, Australia |
| Ace Limestone Retaining Walls | |
| Peter Stewart Homes | 69, Adams Rd |
| Overflow Drilling | 156, Pinjar Rd |
LGA Details (1)
| Headline | Place | Datetime |
|---|---|---|
| Local government area | Wanneroo |
Turnover Rate by Street (28)
| Turnover rate | Street | Turnover Label | Turnover Years | Year |
|---|---|---|---|---|
| 27.3% | Adams Rd | very tightly held | Every 36.7 years (very tightly held) | 2025 |
| 42.1% | Pinjar Rd | very tightly held | Every 23.8 years (very tightly held) | 2025 |
| 60.0% | Ranch Rd | quite tightly held | Every 16.7 years (quite tightly held) | 2025 |
| 12.5% | Honey St | very tightly held | Every 80.0 years (very tightly held) | 2025 |
| 15.4% | Timely Hostess Mews | very tightly held | Every 65.0 years (very tightly held) | 2025 |
Percent of Renters by Street (33)
| Percent of Renters | Street |
|---|---|
| 0.0% | Adams Rd |
| 0.0% | Bronzewing Gr |
| 40.8% | Caporn St |
| 0.0% | Conductor Rtt |
| 12.1% | Coogee Rd |
Recently Sold Houses (97)
| Address | Price | Bedrooms | Bathrooms | Garage spaces | Date sold | Subdivisible into | Sale Type |
|---|---|---|---|---|---|---|---|
| 51 Coogee Rd | Price Withheld | 4.0 | 2.0 | 2.0 | 09 Apr 2025 | 0 | On Market |
| 29 Lee-steere Dr | $4,000,000 | 5.0 | 4.0 | 4.0 | 03 Apr 2025 | 0 | On Market |
| 41 Lakeview St | Price Withheld | 0.0 | 0.0 | 0.0 | 10 Feb 2025 | 0 | On Market |
| 155 Coogee Rd | $1,390,000 | 4.0 | 2.0 | 4.0 | 10 Dec 2024 | 0 | On Market |
| 15 Via Vista Dr | $900,000 | 0.0 | 0.0 | 0.0 | 29 Nov 2024 | 0 | On Market |
Median House Sale Prices by Street (100)
| Street | Date | Median sale value |
|---|---|---|
| Dempster Pl | 10 May 2024 | $1,625,000 |
| Coogee Rd | 10 May 2024 | $1,440,000 |
| James St | 10 May 2024 | $990,000 |
| Pennygum Pl | 10 May 2024 | $2,100,000 |
| Neaves Rd | 10 May 2024 | $1,575,000 |
Recent Rental Unit Listings (100)
| Address | Rent (per week) | Bedrooms | Bathrooms | Garage spaces | Date |
|---|---|---|---|---|---|
| 24 Seminara Pl | Price Withheld | 6.0 | 3.0 | 4.0 | 20 Mar 2021 |
| 24 Seminara Pl | Price Withheld | 6.0 | 3.0 | 4.0 | 20 Mar 2021 |
| 24 Seminara Pl | Price Withheld | 6.0 | 3.0 | 4.0 | 20 Mar 2021 |
| 24 Seminara Pl | Price Withheld | 6.0 | 3.0 | 4.0 | 20 Mar 2021 |
| 24 Seminara Pl | Price Withheld | 6.0 | 3.0 | 4.0 | 20 Mar 2021 |
Recent Rental House Listings (100)
| Address | Rent (per week) | Bedrooms | Bathrooms | Garage spaces | Date | Subdivisible into |
|---|---|---|---|---|---|---|
| 118 Coogee Rd | $650 | 4 | 2 | 5 | 10 May 2024 | 0 |
| 118 Coogee Rd | $650 | 4 | 2 | 5 | 10 May 2024 | 0 |
| 118 Coogee Rd | $650 | 4 | 2 | 5 | 10 May 2024 | 0 |
| 118 Coogee Rd | $650 | 4 | 2 | 5 | 10 May 2024 | 0 |
| 118 Coogee Rd | $650 | 4 | 2 | 5 | 10 May 2024 | 0 |
Recently Sold Units (100)
| Address | Price | Bedrooms | Bathrooms | Garage spaces | Date sold | Sale Type |
|---|---|---|---|---|---|---|
| 51 Coogee Rd | Price Withheld | 4.0 | 2.0 | 2.0 | 09 Apr 2025 | On Market |
| 51 Coogee Rd | Price Withheld | 4.0 | 2.0 | 2.0 | 09 Apr 2025 | On Market |
| 51 Coogee Rd | Price Withheld | 4.0 | 2.0 | 2.0 | 09 Apr 2025 | On Market |
| 41 Lakeview St | Price Withheld | 0.0 | 0.0 | 0.0 | 10 Feb 2025 | On Market |
| 41 Lakeview St | Price Withheld | 0.0 | 0.0 | 0.0 | 10 Feb 2025 | On Market |
Loading entities ..