.png)
Profiles
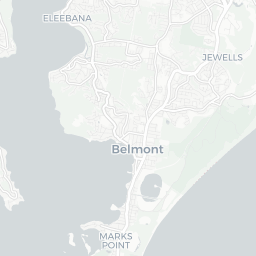
Nearby Suburbs
Real Estate Market: Is Marks Point NSW 2280 a Good Suburb to Buy Into?
Housing Market in Marks Point

Sources: Property Listings, TORREN and Microburbs, 2002 - 2023
| Field | Value | VS Newcastle and Lake Macquarie | Trend | |
|---|---|---|---|---|
| Premium | Premium | Premium | ||
| Premium | Premium | Premium | ||
| Premium | Premium | Premium | ||
| $656 | Top 36% |
|
||
| Premium | Premium | Premium |
Housing Supply in Marks Point

The higher the supply score the more supply is on the market, both current and future.
Sources: ABS, GEOSPATIAL, Property Listings, PLANNING ALERTS, BASIX and Microburbs, 2002 - 2031
Sources: ABS, GEOSPATIAL, Property Listings, PLANNING ALERTS, BASIX and Microburbs, 2002 - 2031
Marks Point
37.7%
Marks Point
37.7%
Newcastle and Lake Macquarie
39.0%
Newcastle and Lake Macquarie
39.0%
| Field | Value | VS Newcastle and Lake Macquarie | Trend | |
|---|---|---|---|---|
| 0 | Bottom 38% |
|
||
| 4.9 | Top 30% | Data for Jul 2023 | ||
| 74.9 | Top 7% | Data for May 2023 | ||
| Premium | Premium | Premium | ||
| Premium | Premium | Premium | ||
| Premium | Premium | Premium | ||
| 2 | Bottom 14% |
|
||
| 2 lots | Bottom 17% | Data for Apr 2023 | ||
| Premium | Premium | Premium | ||
| Premium | Premium | Premium | ||
| Premium | Premium | Premium | ||
| 10 | Top 15% |
|
Housing Stock Quality in Marks Point
The higher the score, the higher the quality of the houses and units.
Sources: ABS, GEOSPATIAL, Property Listings, BASIX and Microburbs, 2006 - 2023
Sources: ABS, GEOSPATIAL, Property Listings, BASIX and Microburbs, 2006 - 2023
| Field | Value | VS Newcastle and Lake Macquarie | Trend | |
|---|---|---|---|---|
| 57.9% | Bottom 5% |
|
||
| 2.1 | Bottom 20% |
|
||
| 96.5% | Top 2% | Data for Jun 2023 | ||
| Premium | Premium | Premium |
Development Restrictions in Marks Point

The higher the score, the more easily density can be increased.
Sources: GEOSPATIAL, TORREN, ABS and Microburbs, 2011 - 2023
Sources: GEOSPATIAL, TORREN, ABS and Microburbs, 2011 - 2023
Marks Point
29.7%
Marks Point
29.7%
Newcastle and Lake Macquarie
37.4%
Newcastle and Lake Macquarie
37.4%
| Field | Value | VS Newcastle and Lake Macquarie | Trend | |
|---|---|---|---|---|
| 0.9 sq km | Bottom 7% | Data for Jan 2021 | ||
| 25.3% | Top 4% | Data for Jun 2023 | ||
| 1 | Bottom 42% | Data for Jun 2023 | ||
| 335 sqm per resident | Bottom 13% | Data for Jan 2021 |
Risk in Marks Point

The higher the score, the more exposed households are to financial stress.
Sources: ABS, Property Listings, TORREN and Microburbs, 2006 - 2023
Sources: ABS, Property Listings, TORREN and Microburbs, 2006 - 2023
Marks Point
64.8%
Marks Point
64.8%
Newcastle and Lake Macquarie
62.9%
Newcastle and Lake Macquarie
62.9%
| Field | Value | VS Newcastle and Lake Macquarie | Trend | |
|---|---|---|---|---|
| 78.3% | Bottom 14% |
|
||
| 21.7% | Top 14% |
|
||
| 42 | Top 23% | Data for Jun 2023 | ||
| $2,090 | Top 41% |
|
||
| 76 | Bottom 39% | Data for Jun 2023 | ||
| 74 | Bottom 36% | Data for Jun 2023 | ||
| 36.9% | Top 6% |
|
||
| 28.0% | Bottom 20% |
|
Housing Demand in Marks Point
The higher the score, the more demand their is for housing in the area, both current and future.
Sources: ABS, TORREN, Property Listings and Microburbs, 1975 - 2030
Sources: ABS, TORREN, Property Listings and Microburbs, 1975 - 2030
Marks Point
75.1%
Marks Point
75.1%
Newcastle and Lake Macquarie
79.6%
Newcastle and Lake Macquarie
79.6%
| Field | Value | VS Newcastle and Lake Macquarie | Trend | |
|---|---|---|---|---|
| Premium | Premium | Premium | ||
| 5450 | Bottom 19% |
|
||
| 128000 | Top 15% |
|
||
| Premium | Premium | Premium | ||
| 221000 | Top 6% |
|
||
| Premium | Premium | Premium | ||
| Premium | Premium | Premium | ||
| Premium | Premium | Premium | ||
| Premium | Premium | Premium |
Unit Market in Marks Point
Sources: Property Listings and Microburbs, 2002 - 2023
| Field | Value | VS Newcastle and Lake Macquarie | Trend | |
|---|---|---|---|---|
| Premium | Premium | Premium | ||
| $513 | Top 49% |
|
||
| Premium | Premium | Premium | ||
| 73.5% | Bottom 49% |
|
Accommodation Options (11)
| Headline | Place | Datetime |
|---|---|---|
| Belmont Palms Motel | 784 Pacific Hwy | |
| Golden Chain Lake Macquarie Motor Inn | 798 Pacific Hwy | |
| Iona Cottage | 135 Marks Point Road | |
| Lake Macquarie Motor Inn | 798 Pacific Hwy | |
| Selby Cottage | 151 Marks Point Rd |
Median House Rental Prices by Street (5)
| Street | Date | Median rent (per week) |
|---|---|---|
| Docker St | 21 Mar 2025 | $490 |
| Emily St | 21 Mar 2025 | $520 |
| Haddon Cr | 21 Mar 2025 | $510 |
| Marks Point Rd | 21 Mar 2025 | $560 |
| Pacific Hwy | 21 Mar 2025 | $505 |
LGA Details (1)
| Headline | Place | Datetime |
|---|---|---|
| Local government area | Lake Macquarie |
Turnover Rate by Street (21)
| Turnover rate | Street | Turnover Label | Turnover Years | Year |
|---|---|---|---|---|
| 90.4% | Docker St | high turnover | Every 11.1 years (high turnover) | 2025 |
| 78.4% | Marks Point Rd | average turnover | Every 12.8 years (average turnover) | 2025 |
| 58.3% | Shannon St | quite tightly held | Every 17.1 years (quite tightly held) | 2025 |
| 51.1% | Marks Pde | quite tightly held | Every 19.6 years (quite tightly held) | 2025 |
| 85.2% | Emily St | average turnover | Every 11.7 years (average turnover) | 2025 |
Planning Applications: Dwellings (54)
| Headline | Place | Date |
|---|---|---|
| Demolition of existing reisdence, alter existing garage and construction of new two storey dwelling, spa and related landscaping - Lake Macquarie City Council DA/40/2024 | 21 Marks Parade, Marks Point NSW 2280 | 17 Jan 2024 |
| Dwelling Alterations and Additions and new detached shed - Lake Macquarie City Council CC/1369/2023/A | 4 Delando Crescent, Marks Point NSW 2280 | 03 Jan 2024 |
| Dwelling, carport and Swimming Pool with Associated Safety Barrier - Lake Macquarie City Council DA/562/2021/A | 26 Marks Parade, Marks Point NSW 2280 | 02 Dec 2023 |
| Drive way approval 2 Storey Dwelling - Lake Macquarie City Council PWC/99/2023 | 6 Marks Parade, Marks Point NSW 2280 | 15 Nov 2023 |
| Three Storey Dwelling, Retaining Walls, Swimming Pool & Associated Safety Barriers - Lake Macquarie City Council CC/1475/2023 | 154 Marks Point Road, Marks Point NSW 2280 | 26 Oct 2023 |
Planning Applications: Other (46)
| Headline | Place | Date |
|---|---|---|
| Demolition of existing reisdence, alter existing garage and construction of new two storey dwelling, spa and related landscaping - Lake Macquarie City Council DA/40/2024 | 21 Marks Parade, Marks Point NSW 2280 | 17 Jan 2024 |
| Dwelling, carport and Swimming Pool with Associated Safety Barrier - Lake Macquarie City Council DA/562/2021/A | 26 Marks Parade, Marks Point NSW 2280 | 02 Dec 2023 |
| Fence, New carport & Extension to Existing Carport - Lake Macquarie City Council CC/1395/2023 | 27B Marks Point Road, Marks Point NSW 2280 | 14 Oct 2023 |
| Demolition of all structures on site and construction of a new dwelling with attached garage - Lake Macquarie City Council DA/1602/2023 | 15 Edith Street, Marks Point NSW 2280 | 18 Sep 2023 |
| Demolition of the existing house and garage as per site plan - Lake Macquarie City Council DA/1475/2023 | 17 Village Bay Close, Marks Point NSW 2280 | 30 Aug 2023 |
Median Unit Sale Prices by Street (100)
| Date | Median sale value | Street |
|---|---|---|
| 10 May 2024 | $921,500 | Emily St |
| 10 May 2024 | $645,000 | Haddon Cr |
| 06 Oct 2023 | $448,600 | Marks Point Rd |
| 06 Oct 2023 | $462,800 | Pacific Hwy |
| 31 May 2024 | 575200.0 | Emily St |
Percent of Renters by Street (21)
| Percent of Renters | Street |
|---|---|
| 38.4% | Ashley St |
| 22.6% | Cygnet St |
| 0.0% | Davis St |
| 62.3% | Delando Cr |
| 13.6% | Docker St |
Recently Sold Houses (100)
| Address | Price | Bedrooms | Bathrooms | Garage spaces | Date sold | Subdivisible into | Sale Type |
|---|---|---|---|---|---|---|---|
| Unit 3, 22 Emily St | $615,000 | 2.0 | 1.0 | 15 Mar 2025 | 0 | On Market | |
| 150 Marks Point Rd | $1,450,000 | 2.0 | 1.0 | 1.0 | 18 Feb 2025 | 0 | On Market |
| 176 Marks Point Rd | Price Withheld | 4.0 | 3.0 | 2.0 | 13 Feb 2025 | 0 | On Market |
| 32 Emily St | Price Withheld | 4.0 | 2.0 | 4.0 | 05 Feb 2025 | 0 | On Market |
| Unit 24, 28 Emily St | $605,000 | 2.0 | 1.0 | 2.0 | 11 Dec 2024 | 0 | On Market |
Businesses (12)
| Name | Address |
|---|---|
| Jeff Brown Electrical | 7/33-39 Haddon Cres, Marks Point NSW 2280, Australia |
| Coastline Building Services Australia | Marks Point NSW 2280, Australia |
| A Carpenter-Builder | |
| Uneek Aluminium | 1, Docker St |
| Uneek Aluminium | 1, Docker St |
Median House Sale Prices by Street (100)
| Street | Date | Median sale value |
|---|---|---|
| Shannon St | 06 Oct 2023 | $1,528,000 |
| Village Bay Cl | 10 May 2024 | $1,500,000 |
| Thompson St | 10 May 2024 | $696,000 |
| Swan St | 10 May 2024 | $850,000 |
| Pacific Hwy | 10 May 2024 | $665,000 |
Recent Rental House Listings (100)
| Address | Rent (per week) | Bedrooms | Bathrooms | Garage spaces | Date | Subdivisible into |
|---|---|---|---|---|---|---|
| Unit 3, 10 Marks Point Rd | $500 | 2 | 1 | 1 | 25 Feb 2025 | 0 |
| Unit 3, 10 Marks Point Rd | $500 | 2 | 1 | 1 | 25 Feb 2025 | 0 |
| Unit 3, 10 Marks Point Rd | $500 | 2 | 1 | 1 | 25 Feb 2025 | 0 |
| Unit 13, 9 Haddon Cr | $520 | 2 | 1 | 1 | 12 Feb 2025 | 0 |
| Unit 13, 9 Haddon Cr | $495 | 2 | 1 | 1 | 12 Feb 2025 | 0 |
Recent Rental Unit Listings (100)
| Address | Rent (per week) | Bedrooms | Bathrooms | Garage spaces | Date |
|---|---|---|---|---|---|
| Unit 8, 67 Marks Point Rd | $575 | 2.0 | 1.0 | 1.0 | 19 Feb 2025 |
| Unit 8, 67 Marks Point Rd | $575 | 2.0 | 1.0 | 1.0 | 19 Feb 2025 |
| Unit 8, 67 Marks Point Rd | $575 | 2.0 | 1.0 | 1.0 | 19 Feb 2025 |
| Unit 8, 67 Marks Point Rd | $575 | 2.0 | 1.0 | 1.0 | 19 Feb 2025 |
| Unit 8, 67 Marks Point Rd | $575 | 2.0 | 1.0 | 1.0 | 19 Feb 2025 |
Recently Sold Units (100)
| Address | Price | Bedrooms | Bathrooms | Garage spaces | Date sold | Sale Type |
|---|---|---|---|---|---|---|
| Unit 3, 3 Marks Point Rd | $570,000 | 2.0 | 1.0 | 2.0 | 20 Mar 2025 | On Market |
| Unit 3, 3 Marks Point Rd | $570,000 | 2.0 | 1.0 | 2.0 | 20 Mar 2025 | On Market |
| Unit 3, 22 Emily St | $615,000 | 2.0 | 1.0 | 15 Mar 2025 | On Market | |
| Unit 19, 33-39 Haddon Cr | $700,000 | 3.0 | 1.0 | 1.0 | 20 Dec 2024 | On Market |
| Unit 19, 33-39 Haddon Cr | $700,000 | 3.0 | 1.0 | 1.0 | 20 Dec 2024 | On Market |
Loading entities ..