.png)
Profiles
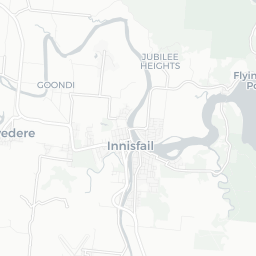
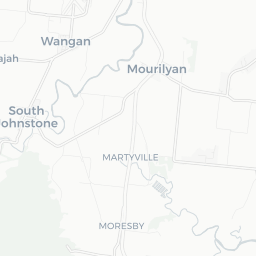
Nearby Suburbs
Real Estate Market: Is Mighell QLD 4860 a Good Suburb to Buy Into?
Housing Market in Mighell

Sources: Property Listings and Microburbs, 2002 - 2023
| Field | Value | VS Cairns | Trend | |
|---|---|---|---|---|
| Premium | Premium | Premium | ||
| Premium | Premium | Premium | ||
| Premium | Premium | Premium | ||
| $471 | Bottom 11% |
|
||
| Premium | Premium | Premium |
Housing Supply in Mighell

The higher the supply score the more supply is on the market, both current and future.
Sources: ABS, GEOSPATIAL, Property Listings, PLANNING ALERTS and Microburbs, 2002 - 2023
Sources: ABS, GEOSPATIAL, Property Listings, PLANNING ALERTS and Microburbs, 2002 - 2023
Mighell
55.3%
Mighell
55.3%
Cairns
39.8%
Cairns
39.8%
| Field | Value | VS Cairns | Trend | |
|---|---|---|---|---|
| 943 | Top 5% |
|
||
| 14.9 | Top 11% | Data for Jul 2023 | ||
| Premium | Premium | Premium | ||
| Premium | Premium | Premium | ||
| Premium | Premium | Premium | ||
| Premium | Premium | Premium | ||
| 0 | Bottom 25% | Data for Apr 2025 |
Housing Stock Quality in Mighell
The higher the score, the higher the quality of the houses and units.
Sources: ABS, GEOSPATIAL, Property Listings and Microburbs, 2006 - 2023
Sources: ABS, GEOSPATIAL, Property Listings and Microburbs, 2006 - 2023
| Field | Value | VS Cairns | Trend | |
|---|---|---|---|---|
| 63.9% | Bottom 6% |
|
||
| 2.0 | Bottom 15% | Data for Jan 2021 | ||
| 13.2% | Top 14% | Data for Jun 2023 |
Development Restrictions in Mighell

The higher the score, the more easily density can be increased.
Sources: GEOSPATIAL, TORREN, ABS and Microburbs, 2011 - 2023
Sources: GEOSPATIAL, TORREN, ABS and Microburbs, 2011 - 2023
Mighell
35.0%
Mighell
35.0%
Cairns
37.5%
Cairns
37.5%
| Field | Value | VS Cairns | Trend | |
|---|---|---|---|---|
| 4.2 sq km | Bottom 37% | Data for Jan 2021 | ||
| 0.0 sq km | Bottom 39% | Data for Jun 2023 | ||
| 7600 sqm per resident | Top 19% | Data for Jan 2021 |
Risk in Mighell

The higher the score, the more exposed households are to financial stress.
Sources: ABS, Property Listings, TORREN and Microburbs, 2006 - 2023
Sources: ABS, Property Listings, TORREN and Microburbs, 2006 - 2023
Mighell
68.8%
Mighell
68.8%
Cairns
70.7%
Cairns
70.7%
| Field | Value | VS Cairns | Trend | |
|---|---|---|---|---|
| 83.1% | Bottom 22% |
|
||
| 16.9% | Top 22% |
|
||
| 22 | Bottom 15% | Data for Jun 2023 | ||
| $1,280 | Bottom 18% |
|
||
| 79 | Top 44% | Data for Jun 2023 | ||
| 82 | Top 13% | Data for Jun 2023 | ||
| 27.6% | Top 23% |
|
||
| 21.0% | Bottom 8% |
|
Housing Demand in Mighell
The higher the score, the more demand their is for housing in the area, both current and future.
Sources: ABS, TORREN, Property Listings and Microburbs, 2006 - 2030
Sources: ABS, TORREN, Property Listings and Microburbs, 2006 - 2030
Mighell
40.3%
Mighell
40.3%
Cairns
58.6%
Cairns
58.6%
| Field | Value | VS Cairns | Trend | |
|---|---|---|---|---|
| Premium | Premium | Premium | ||
| Premium | Premium | Premium | ||
| 9390 | Bottom 49% |
|
||
| 36300 | Bottom 19% |
|
||
| Premium | Premium | Premium | ||
| 31000 | Top 35% |
|
||
| Premium | Premium | Premium | ||
| Premium | Premium | Premium | ||
| Premium | Premium | Premium |
Unit Market in Mighell
Sources: Property Listings and Microburbs, 2002 - 2023
| Field | Value | VS Cairns | Trend | |
|---|---|---|---|---|
| Premium | Premium | Premium | ||
| Premium | Premium | Premium | ||
| Premium | Premium | Premium | ||
| $184 | Bottom 0% |
|
||
| Premium | Premium | Premium | ||
| 80.7% | Top 41% |
|
LGA Details (1)
| Headline | Place | Datetime |
|---|---|---|
| Local government area | Cassowary Coast |
Turnover Rate by Street (11)
| Turnover rate | Street | Turnover Label | Turnover Years | Year |
|---|---|---|---|---|
| 80.6% | River Ave | average turnover | Every 12.4 years (average turnover) | 2025 |
| 81.0% | Stitt St | average turnover | Every 12.4 years (average turnover) | 2025 |
| 187.5% | May St | very high turnover | Every 5.3 years (very high turnover) | 2025 |
| 56.2% | Ida St | quite tightly held | Every 17.8 years (quite tightly held) | 2025 |
| 54.5% | Spina Ct | quite tightly held | Every 18.3 years (quite tightly held) | 2025 |
Percent of Renters by Street (12)
| Percent of Renters | Street |
|---|---|
| 0.0% | Callow St |
| 0.0% | Douglas Rd |
| 0.0% | Downing St |
| 0.0% | Eslick St |
| 0.0% | Ida St |
Median Unit Sale Prices by Street (71)
| Date | Median sale value | Street |
|---|---|---|
| 10 May 2024 | $207,500 | River Ave |
| 31 May 2024 | 301800.0 | May St |
| 31 May 2024 | 339700.0 | River Ave |
| 30 Jun 2024 | 232100.0 | May St |
| 30 Jun 2024 | 236500.0 | May St |
Recently Sold Houses (31)
| Address | Price | Bedrooms | Bathrooms | Garage spaces | Date sold | Subdivisible into | Sale Type |
|---|---|---|---|---|---|---|---|
| Lot 902 Scullen Ave | Price Withheld | 1.0 | 1.0 | 0.0 | 15 Jan 2025 | 0 | On Market |
| Lot 11 Downing St | Price Withheld | 0.0 | 0.0 | 0.0 | 10 Dec 2024 | 0 | On Market |
| 10 Scullen Ave | $287,000 | 4.0 | 1.0 | 1.0 | 19 Nov 2024 | 0 | On Market |
| 60 River Ave | $315,000 | 3.0 | 1.0 | 3.0 | 01 Oct 2024 | 0 | On Market |
| 6 Jones St | $185,000 | 3.0 | 1.0 | 2.0 | 30 Aug 2024 | 0 | On Market |
Planning Applications: Other (8)
| Headline | Place | Date |
|---|---|---|
| Duplex - Class 1a - 307.82m2 including Plumbing & Drainage - Cassowary Coast Regional Council DA0159/25 | Spina Court Mighell QLD 4860 | 22 Mar 2025 |
| Extension of 3 x Shade Structures - Class 10a - 30.78m2, 59.28m2 & 53.36m2 - Cassowary Coast Regional Council DA0083/25 | 15-17 Stitt Street Mighell QLD 4860 | 05 Feb 2025 |
| Unit Building (22 Units) - Class 2 - Cassowary Coast Regional Council DA0469/23 | 80-86 River Avenue Mighell QLD 4860 | 28 Sep 2023 |
| Extension to currency period Related to: OPW18/0006 - Operational work for roadworks Related to: RAL17/0008 - Cassowary Coast Regional Council OPW18/0006.02 | 26 Callow Street Mighell QLD 4860 | 21 Nov 2021 |
| Extension to the currency period of a development approval - RAL17/0008 - Reconfiguring a Lot (3 Lots into 4 Lots) - Cassowary Coast Regional Council RAL17/0008.01 | Callow Street Mighell QLD 4860 | 18 Nov 2021 |
Planning Applications: Dwellings (20)
| Headline | Place | Date |
|---|---|---|
| Dwelling inc P&D - Class 1a - 194.63m2 - Cassowary Coast Regional Council DA0154/25 | Scullen Avenue Mighell QLD 4860 | 20 Mar 2025 |
| Referral agency assessment against the Queensland Development Code for a front boundary setback dispensation for a Dwelling house - Cassowary Coast Regional Council CAR25/0012 | 11 Downing Street Mighell QLD 4860 | 28 Feb 2025 |
| Material change of use for 3 x Dual occupancies on future residential lots 301, 306 and 309 - Cassowary Coast Regional Council MCU24/0048 | Scullen Avenue Mighell QLD 4860 | 23 Oct 2024 |
| Material change of use for 4 x Dual occupancies on future residential lots 303, 305, 310 and 311 - Cassowary Coast Regional Council MCU24/0043 | Scullen Avenue Mighell QLD 4860 | 16 Oct 2024 |
| Material change of use for 3 x Dual occupancies on future residential lots 307, 315 and 315 - Cassowary Coast Regional Council MCU24/0044 | Scullen Avenue Mighell QLD 4860 | 16 Oct 2024 |
Median House Sale Prices by Street (100)
| Street | Date | Median sale value |
|---|---|---|
| Spina Ct | 06 Oct 2023 | $440,000 |
| Jones St | 06 Oct 2023 | $337,100 |
| Stitt St | 06 Oct 2023 | $270,000 |
| Scullen Ave | 06 Oct 2023 | $402,000 |
| River Ave | 10 May 2024 | $425,000 |
Recent Rental House Listings (100)
| Address | Rent (per week) | Bedrooms | Bathrooms | Garage spaces | Date | Subdivisible into |
|---|---|---|---|---|---|---|
| 10 Scullen Ave | $480 | 3 | 1 | 1 | 28 Jan 2025 | 0 |
| 10 Scullen Ave | $480 | 3 | 1 | 1 | 28 Jan 2025 | 0 |
| 10 Scullen Ave | $480 | 3 | 1 | 1 | 28 Jan 2025 | 0 |
| 10 Scullen Ave | $480 | 3 | 1 | 1 | 28 Jan 2025 | 0 |
| 10 Scullen Ave | $480 | 3 | 1 | 1 | 28 Jan 2025 | 0 |
Recent Rental Unit Listings (100)
| Address | Rent (per week) | Bedrooms | Bathrooms | Garage spaces | Date |
|---|---|---|---|---|---|
| 1/30 River Ave | $225 | Unknown | Unknown | Unknown | 02 Mar 2022 |
| Unit 2, 30 River Ave | $235 | 2.0 | 1.0 | 1.0 | 29 Sep 2021 |
| Unit 2, 30 River Ave | $235 | 2.0 | 1.0 | 1.0 | 29 Sep 2021 |
| Unit 2, 30 River Ave | $235 | 2.0 | 1.0 | 1.0 | 29 Sep 2021 |
| Unit 2, 30 River Ave | $235 | 2.0 | 1.0 | 1.0 | 29 Sep 2021 |
Recently Sold Units (100)
| Address | Price | Bedrooms | Bathrooms | Garage spaces | Date sold | Sale Type |
|---|---|---|---|---|---|---|
| Lot 11 Downing St | Price Withheld | 0.0 | 0.0 | 0.0 | 10 Dec 2024 | On Market |
| Lot 11 Downing St | Price Withheld | 0.0 | 0.0 | 0.0 | 10 Dec 2024 | On Market |
| Lot 11 Downing St | Price Withheld | 0.0 | 0.0 | 0.0 | 10 Dec 2024 | On Market |
| Lot 11 Downing St | Price Withheld | 0.0 | 0.0 | 0.0 | 10 Dec 2024 | On Market |
| Lot 11 Downing St | Price Withheld | 0.0 | 0.0 | 0.0 | 10 Dec 2024 | On Market |
Loading entities ..