.png)
Profiles
Nearby Suburbs
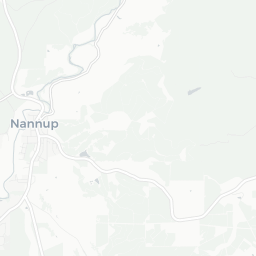
Real Estate Market: Is Nannup WA 6275 a Good Suburb to Buy Into?
Housing Market in Nannup

Sources: Property Listings and Microburbs, 2002 - 2023
| Field | Value | VS Bunbury | Trend | |
|---|---|---|---|---|
| Premium | Premium | Premium | ||
| Premium | Premium | Premium | ||
| Premium | Premium | Premium | ||
| $719 | Top 20% |
|
||
| Premium | Premium | Premium |
Housing Supply in Nannup

The higher the supply score the more supply is on the market, both current and future.
Sources: ABS, GEOSPATIAL, Property Listings and Microburbs, 2002 - 2023
Sources: ABS, GEOSPATIAL, Property Listings and Microburbs, 2002 - 2023
Nannup
53.8%
Nannup
53.8%
Bunbury
43.8%
Bunbury
43.8%
| Field | Value | VS Bunbury | Trend | |
|---|---|---|---|---|
| 0 | Bottom 38% | Data for Jun 2025 | ||
| 2.0 | Bottom 45% | Data for Jul 2023 | ||
| 27.5 | Top 21% | Data for May 2023 | ||
| Premium | Premium | Premium | ||
| Premium | Premium | Premium | ||
| Premium | Premium | Premium | ||
| Premium | Premium | Premium | ||
| Premium | Premium | Premium | ||
| 7 | Top 19% |
|
Housing Stock Quality in Nannup
The higher the score, the higher the quality of the houses and units.
Sources: ABS, GEOSPATIAL, Property Listings and Microburbs, 2006 - 2023
Sources: ABS, GEOSPATIAL, Property Listings and Microburbs, 2006 - 2023
| Field | Value | VS Bunbury | Trend | |
|---|---|---|---|---|
| 92.6% | Bottom 24% |
|
||
| 2.1 | Bottom 20% |
|
||
| 0.0% | Bottom 37% | Data for Jun 2023 |
Development Restrictions in Nannup

The higher the score, the more easily density can be increased.
Sources: GEOSPATIAL, TORREN, ABS and Microburbs, 2011 - 2023
Sources: GEOSPATIAL, TORREN, ABS and Microburbs, 2011 - 2023
Nannup
22.3%
Nannup
22.3%
Bunbury
27.0%
Bunbury
27.0%
| Field | Value | VS Bunbury | Trend | |
|---|---|---|---|---|
| 110.0 sq km | Top 10% | Data for Jan 2021 | ||
| 4370 sqm per resident | Top 28% | Data for Jan 2021 |
Risk in Nannup

The higher the score, the more exposed households are to financial stress.
Sources: ABS, Property Listings, TORREN and Microburbs, 2006 - 2023
Sources: ABS, Property Listings, TORREN and Microburbs, 2006 - 2023
Nannup
47.4%
Nannup
47.4%
Bunbury
52.3%
Bunbury
52.3%
| Field | Value | VS Bunbury | Trend | |
|---|---|---|---|---|
| 91.1% | Bottom 46% |
|
||
| 8.9% | Top 46% |
|
||
| 33 | Bottom 49% | Data for Jun 2023 | ||
| $1,400 | Bottom 23% |
|
||
| 69 | Bottom 9% | Data for Jun 2023 | ||
| 64 | Bottom 8% | Data for Jun 2023 | ||
| 29.0% | Top 18% |
|
||
| 31.3% | Bottom 29% |
|
Housing Demand in Nannup
The higher the score, the more demand their is for housing in the area, both current and future.
Sources: ABS, TORREN, Property Listings and Microburbs, 2006 - 2030
Sources: ABS, TORREN, Property Listings and Microburbs, 2006 - 2030
Nannup
22.8%
Nannup
22.8%
Bunbury
48.1%
Bunbury
48.1%
| Field | Value | VS Bunbury | Trend | |
|---|---|---|---|---|
| Premium | Premium | Premium | ||
| Premium | Premium | Premium | ||
| 4990 | Bottom 15% |
|
||
| 25100 | Bottom 12% |
|
||
| Premium | Premium | Premium | ||
| 1330 | Bottom 16% |
|
||
| Premium | Premium | Premium | ||
| Premium | Premium | Premium | ||
| Premium | Premium | Premium |
Unit Market in Nannup
Sources: Property Listings and Microburbs, 2002 - 2023
| Field | Value | VS Bunbury | Trend | |
|---|---|---|---|---|
| Premium | Premium | Premium | ||
| $576 | Top 24% |
|
||
| Premium | Premium | Premium | ||
| 88.8% | Top 19% |
|
Businesses (10)
| Name | Address |
|---|---|
| Ray White South West Central | 24 Warren Rd, Nannup WA 6275, Australia |
| Thrifty Link Hardware - Nannup Hardware & Agencies | 67 Warren Rd, Nannup WA 6275, Australia |
| Ray White Nannup | 24A Warren Rd |
| Word Of Mouth Country Living | 68, Warren Rd |
| Word Of Mouth Country Living | 68, Warren Rd |
Accommodation Options (11)
| Name | Address |
|---|---|
| The Black Cockatoo Nannup | 27 Grange St, Nannup WA 6275, Australia |
| Holberry House | |
| Redgum Hill Country Retreat | 2526 Balingup-Nannup Rd, Nannup WA 6275, Australia |
| Loose Goose Chalets | LOT 4027 Barrabup Rd, Nannup WA 6275, Australia |
| Nannup Hotel-Motel | 12, Warren Rd |
LGA Details (1)
| Headline | Place | Datetime |
|---|---|---|
| Local government area | Nannup |
Realtors (1)
| Headline | Place | Datetime |
|---|---|---|
| Ray White Nannup | 24A Warren Rd |
Turnover Rate by Street (48)
| Turnover rate | Street | Turnover Label | Turnover Years | Year |
|---|---|---|---|---|
| 133.3% | Hitchcock Dr | very high turnover | Every 7.5 years (very high turnover) | 2025 |
| 82.6% | North St | average turnover | Every 12.1 years (average turnover) | 2025 |
| 136.4% | Struthers St | very high turnover | Every 7.3 years (very high turnover) | 2025 |
| 28.6% | Higgins St | very tightly held | Every 35.0 years (very tightly held) | 2025 |
| 112.5% | Wilson St | very high turnover | Every 8.9 years (very high turnover) | 2025 |
Percent of Renters by Street (57)
| Percent of Renters | Street |
|---|---|
| 0.0% | Balingup Rd |
| 2.1% | Adam St |
| 0.0% | Balingup-Nannup Rd |
| 0.0% | Balmoral Rd |
| 0.0% | Barrabup Rd |
Median Unit Sale Prices by Street (1)
| Date | Median sale value | Street |
|---|---|---|
| 25 Apr 2024 | $117,500 | Wilson St |
Median House Sale Prices by Street (100)
| Street | Date | Median sale value |
|---|---|---|
| Struthers St | 06 Oct 2023 | $540,000 |
| Carey St | 10 May 2024 | $500,000 |
| Adam St | 10 May 2024 | $507,500 |
| Dunnet Rd | 10 May 2024 | $452,500 |
| Hitchcock Dr | 10 May 2024 | $360,000 |
Recently Sold Houses (100)
| Address | Price | Bedrooms | Bathrooms | Garage spaces | Date sold | Subdivisible into | Sale Type |
|---|---|---|---|---|---|---|---|
| 17 Mcalpine Mews | Price Withheld | 0.0 | 0.0 | 0.0 | 06 Mar 2025 | 0 | On Market |
| 28 Struthers St | $340,000 | 0.0 | 0.0 | 0.0 | 19 Feb 2025 | 0 | On Market |
| 5965 Vasse Hwy | Price Withheld | 1.0 | 1.0 | 2.0 | 23 Jan 2025 | 0 | On Market |
| 4 Hitchcock Dr | Price Withheld | 4.0 | 2.0 | 0.0 | 20 Jan 2025 | 0 | On Market |
| 9 Diggers Green | Price Withheld | 0.0 | 0.0 | 0.0 | 06 Jan 2025 | 0 | On Market |
Recently Sold Units (100)
| Address | Price | Bedrooms | Bathrooms | Garage spaces | Date sold | Sale Type |
|---|---|---|---|---|---|---|
| 17 Mcalpine Mews | Price Withheld | 0.0 | 0.0 | 0.0 | 06 Mar 2025 | On Market |
| 28 Struthers St | $340,000 | 0.0 | 0.0 | 0.0 | 19 Feb 2025 | On Market |
| 28 Struthers St | $340,000 | 0.0 | 0.0 | 0.0 | 19 Feb 2025 | On Market |
| 28 Struthers St | $340,000 | 0.0 | 0.0 | 0.0 | 19 Feb 2025 | On Market |
| 28 Struthers St | $340,000 | 0.0 | 0.0 | 0.0 | 19 Feb 2025 | On Market |
Recent Rental House Listings (100)
| Address | Rent (per week) | Bedrooms | Bathrooms | Garage spaces | Date | Subdivisible into |
|---|---|---|---|---|---|---|
| 4 Hitchcock Dr | $600 | 4 | 2 | 0 | 22 Jan 2025 | 0 |
| 4 Hitchcock Dr | $600 | 4 | 2 | 0 | 22 Jan 2025 | 0 |
| 4 Hitchcock Dr | $600 | 4 | 2 | 0 | 22 Jan 2025 | 0 |
| 4 Hitchcock Dr | $600 | 4 | 2 | 0 | 22 Jan 2025 | 0 |
| 4 Hitchcock Dr | $600 | 4 | 2 | 0 | 22 Jan 2025 | 0 |
Recent Rental Unit Listings (57)
| Address | Rent (per week) | Bedrooms | Bathrooms | Garage spaces | Date |
|---|---|---|---|---|---|
| 20 Sexton Way | $200 | 1.0 | 1.0 | 0.0 | 22 Aug 2024 |
| 20 Sexton Way | $50 | 1.0 | 1.0 | 0.0 | 22 Aug 2024 |
| 20 Sexton Way | $50 | 1.0 | 1.0 | 0.0 | 22 Aug 2024 |
| 20 Sexton Way | $50 | 1.0 | 1.0 | 0.0 | 22 Aug 2024 |
| 20 Sexton Way | $50 | 1.0 | 1.0 | 0.0 | 22 Aug 2024 |
Loading entities ..