.png)
Profiles
Nearby Suburbs
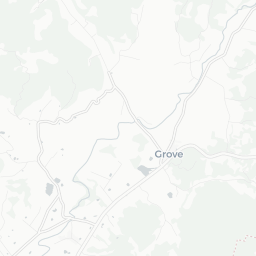
Real Estate Market: Is Neika TAS 7054 a Good Suburb to Buy Into?
Housing Market in Neika

Sources: Property Listings and Microburbs, 2006 - 2023
| Field | Value | VS Hobart | Trend | |
|---|---|---|---|---|
| Premium | Premium | Premium | ||
| Premium | Premium | Premium | ||
| Premium | Premium | Premium | ||
| $608 | Top 44% |
|
||
| Premium | Premium | Premium |
Housing Supply in Neika

The higher the supply score the more supply is on the market, both current and future.
Sources: ABS, GEOSPATIAL and Microburbs, 2002 - 2023
Sources: ABS, GEOSPATIAL and Microburbs, 2002 - 2023
Neika
35.2%
Neika
35.2%
Hobart
34.1%
Hobart
34.1%
| Field | Value | VS Hobart | Trend | |
|---|---|---|---|---|
| 0 | Bottom 38% | Data for Jun 2025 | ||
| 2.1 | Bottom 45% | Data for Jul 2023 | ||
| Premium | Premium | Premium | ||
| Premium | Premium | Premium | ||
| Premium | Premium | Premium | ||
| Premium | Premium | Premium | ||
| 1 | Top 44% |
|
Housing Stock Quality in Neika
The higher the score, the higher the quality of the houses and units.
Sources: ABS, GEOSPATIAL and Microburbs, 2006 - 2023
Sources: ABS, GEOSPATIAL and Microburbs, 2006 - 2023
| Field | Value | VS Hobart | Trend | |
|---|---|---|---|---|
| 100.0% | Top 31% |
|
||
| 2.5 | Top 48% |
|
||
| 0.0% | Bottom 37% | Data for Jun 2023 |
Development Restrictions in Neika

The higher the score, the more easily density can be increased.
Sources: GEOSPATIAL, TORREN, ABS and Microburbs, 2011 - 2023
Sources: GEOSPATIAL, TORREN, ABS and Microburbs, 2011 - 2023
Neika
20.5%
Neika
20.5%
Hobart
29.9%
Hobart
29.9%
| Field | Value | VS Hobart | Trend | |
|---|---|---|---|---|
| 0.9 sq km | Bottom 8% | Data for Jan 2021 | ||
| 2170 sqm per resident | Top 40% | Data for Jan 2021 |
Risk in Neika

The higher the score, the more exposed households are to financial stress.
Sources: ABS, Property Listings, TORREN and Microburbs, 2006 - 2023
Sources: ABS, Property Listings, TORREN and Microburbs, 2006 - 2023
Neika
35.7%
Neika
35.7%
Hobart
50.0%
Hobart
50.0%
| Field | Value | VS Hobart | Trend | |
|---|---|---|---|---|
| 49 | Top 14% | Data for Jun 2023 | ||
| 71 | Bottom 15% | Data for Jun 2023 | ||
| 67 | Bottom 13% | Data for Jun 2023 | ||
| 18.1% | Bottom 30% |
|
Housing Demand in Neika
The higher the score, the more demand their is for housing in the area, both current and future.
Sources: ABS, TORREN, Property Listings and Microburbs, 2006 - 2030
Sources: ABS, TORREN, Property Listings and Microburbs, 2006 - 2030
Neika
57.0%
Neika
57.0%
Hobart
61.6%
Hobart
61.6%
| Field | Value | VS Hobart | Trend | |
|---|---|---|---|---|
| Premium | Premium | Premium | ||
| Premium | Premium | Premium | ||
| 37600 | Bottom 20% |
|
||
| Premium | Premium | Premium | ||
| 42500 | Top 29% |
|
||
| Premium | Premium | Premium | ||
| Premium | Premium | Premium |
LGA Details (1)
| Headline | Place | Datetime |
|---|---|---|
| Local government area | Kingborough |
Turnover Rate by Street (4)
| Turnover rate | Street | Turnover Label | Turnover Years | Year |
|---|---|---|---|---|
| 80.0% | Wolfes Rd | average turnover | Every 12.5 years (average turnover) | 2025 |
| 70.0% | Betts Rd | average turnover | Every 14.3 years (average turnover) | 2025 |
| 75.0% | Morphetts Rd | average turnover | Every 13.3 years (average turnover) | 2025 |
| 70.0% | Huon Rd | average turnover | Every 14.3 years (average turnover) | 2025 |
Percent of Renters by Street (4)
| Percent of Renters | Street |
|---|---|
| 47.1% | Betts Rd |
| 11.1% | Huon Rd |
| 0.0% | Morphetts Rd |
| 0.0% | Wolfes Rd |
Recently Sold Houses (24)
| Address | Price | Bedrooms | Bathrooms | Garage spaces | Date sold | Subdivisible into | Sale Type |
|---|---|---|---|---|---|---|---|
| 2 Morphetts Rd | Price Withheld | 0.0 | 0.0 | 0.0 | 30 Oct 2024 | 0 | On Market |
| 950 Huon Rd | Price Withheld | 3.0 | 1.0 | 3.0 | 19 Feb 2024 | 0 | On Market |
| 71 Wolfes Rd | $855,000 | 3.0 | 1.0 | 4.0 | 12 Apr 2023 | 0 | On Market |
| 71 Wolfes Rd | $855,000 | 12 Apr 2023 | 0 | On Market | |||
| 1520 Huon Rd | $1,400,000 | 5.0 | 2.0 | 6.0 | 04 Oct 2022 | 0 | On Market |
Businesses (3)
| Name | Address |
|---|---|
| Pybus D J | 1300, Huon Rd |
| Pybus D J | 1300, Huon Rd |
| Pybus D J | 1300, Huon Rd |
Median House Sale Prices by Street (62)
| Street | Date | Median sale value |
|---|---|---|
| Betts Rd | 06 Oct 2023 | $855,000 |
| Huon Rd | 06 Oct 2023 | $1,026,000 |
| Morphetts Rd | 06 Oct 2023 | $329,200 |
| Wolfes Rd | 06 Oct 2023 | $855,000 |
| Betts Rd | 31 May 2024 | 682900.0 |
Recent Rental House Listings (100)
| Address | Rent (per week) | Bedrooms | Bathrooms | Garage spaces | Date | Subdivisible into |
|---|---|---|---|---|---|---|
| 111 Betts Rd | Price Withheld | 3 | 2 | 3 | 04 Jul 2022 | 0 |
| 111 Betts Rd | Price Withheld | 3 | 2 | 3 | 04 Jul 2022 | 0 |
| 111 Betts Rd | Price Withheld | 3 | 2 | 3 | 04 Jul 2022 | 0 |
| 111 Betts Rd | Price Withheld | 3 | 2 | 3 | 04 Jul 2022 | 0 |
| 111 Betts Rd | Price Withheld | 3 | 2 | 3 | 04 Jul 2022 | 0 |
Recently Sold Units (100)
| Address | Price | Bedrooms | Bathrooms | Garage spaces | Date sold | Sale Type |
|---|---|---|---|---|---|---|
| 2 Morphetts Rd | Price Withheld | 0.0 | 0.0 | 0.0 | 30 Oct 2024 | On Market |
| 2 Morphetts Rd | Price Withheld | 0.0 | 0.0 | 0.0 | 30 Oct 2024 | On Market |
| 2 Morphetts Rd | Price Withheld | 0.0 | 0.0 | 0.0 | 30 Oct 2024 | On Market |
| 2 Morphetts Rd | Price Withheld | 0.0 | 0.0 | 0.0 | 30 Oct 2024 | On Market |
| 2 Morphetts Rd | Price Withheld | 0.0 | 0.0 | 0.0 | 30 Oct 2024 | On Market |
Loading entities ..