.png)
Profiles
Nearby Suburbs
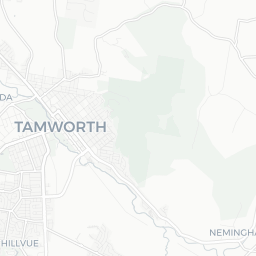
Real Estate Market: Is Nemingha NSW 2340 a Good Suburb to Buy Into?
Housing Market in Nemingha

Sources: Property Listings, TORREN and Microburbs, 2002 - 2023
| Field | Value | VS New England and North West | Trend | |
|---|---|---|---|---|
| Premium | Premium | Premium | ||
| Premium | Premium | Premium | ||
| Premium | Premium | Premium | ||
| $508 | Bottom 24% |
|
||
| Premium | Premium | Premium |
Housing Supply in Nemingha

The higher the supply score the more supply is on the market, both current and future.
Sources: ABS, GEOSPATIAL, Property Listings, PLANNING ALERTS, BASIX and Microburbs, 2002 - 2031
Sources: ABS, GEOSPATIAL, Property Listings, PLANNING ALERTS, BASIX and Microburbs, 2002 - 2031
Nemingha
34.9%
Nemingha
34.9%
New England and North West
40.2%
New England and North West
40.2%
| Field | Value | VS New England and North West | Trend | |
|---|---|---|---|---|
| 621 | Top 8% |
|
||
| 0.6 | Bottom 29% | Data for Jul 2023 | ||
| Premium | Premium | Premium | ||
| Premium | Premium | Premium | ||
| Premium | Premium | Premium | ||
| 2 | Bottom 14% |
|
||
| 14 lots | Top 22% |
|
||
| Premium | Premium | Premium | ||
| Premium | Premium | Premium | ||
| Premium | Premium | Premium | ||
| 2 | Top 33% |
|
Housing Stock Quality in Nemingha
The higher the score, the higher the quality of the houses and units.
Sources: ABS, GEOSPATIAL, Property Listings, BASIX and Microburbs, 2006 - 2023
Sources: ABS, GEOSPATIAL, Property Listings, BASIX and Microburbs, 2006 - 2023
| Field | Value | VS New England and North West | Trend | |
|---|---|---|---|---|
| 100.0% | Top 31% |
|
||
| 2.4 | Bottom 42% |
|
||
| 0.0% | Top 24% | Data for Jun 2023 | ||
| Premium | Premium | Premium |
Development Restrictions in Nemingha

The higher the score, the more easily density can be increased.
Sources: GEOSPATIAL, TORREN, ABS and Microburbs, 2011 - 2023
Sources: GEOSPATIAL, TORREN, ABS and Microburbs, 2011 - 2023
Nemingha
28.5%
Nemingha
28.5%
New England and North West
28.8%
New England and North West
28.8%
| Field | Value | VS New England and North West | Trend | |
|---|---|---|---|---|
| 33.0 sq km | Top 28% | Data for Jan 2021 | ||
| 1.10 | Top 21% | Data for Feb 2023 | ||
| 0.0% | Bottom 31% | Data for Jun 2023 | ||
| 4 | Top 30% | Data for Jun 2023 | ||
| 946 sqm per resident | Bottom 43% | Data for Jan 2021 |
Risk in Nemingha

The higher the score, the more exposed households are to financial stress.
Sources: ABS, Property Listings, TORREN and Microburbs, 2006 - 2023
Sources: ABS, Property Listings, TORREN and Microburbs, 2006 - 2023
Nemingha
40.8
Nemingha
40.8
New England and North West
38.6
New England and North West
38.6
| Field | Value | VS New England and North West | Trend | |
|---|---|---|---|---|
| 95.7% | Top 35% | 0 to May 2023 | ||
| 4.3% | Bottom 35% |
|
||
| 38 | Top 34% | Data for Jun 2023 | ||
| $2,090 | Top 41% |
|
||
| 80 | Top 42% | Data for Jun 2023 | ||
| 78 | Top 36% | Data for Jun 2023 | ||
| 21.9% | Bottom 48% |
|
||
| 46.6% | Top 29% |
|
Housing Demand in Nemingha
The higher the score, the more demand their is for housing in the area, both current and future.
Sources: ABS, TORREN, Property Listings and Microburbs, 1975 - 2030
Sources: ABS, TORREN, Property Listings and Microburbs, 1975 - 2030
Nemingha
59.4%
Nemingha
59.4%
New England and North West
48.0%
New England and North West
48.0%
| Field | Value | VS New England and North West | Trend | |
|---|---|---|---|---|
| Premium | Premium | Premium | ||
| Premium | Premium | Premium | ||
| 22700 | Top 13% |
|
||
| 87200 | Top 35% |
|
||
| Premium | Premium | Premium | ||
| 67000 | Top 21% |
|
||
| Premium | Premium | Premium | ||
| Premium | Premium | Premium | ||
| Premium | Premium | Premium |
Unit Market in Nemingha
Sources: Property Listings and Microburbs, 2002 - 2023
| Field | Value | VS New England and North West | Trend | |
|---|---|---|---|---|
| Premium | Premium | Premium | ||
| Premium | Premium | Premium | ||
| Premium | Premium | Premium | ||
| $377 | Bottom 9% |
|
||
| Premium | Premium | Premium | ||
| 66.6% | Bottom 39% |
|
LGA Details (1)
| Headline | Place | Datetime |
|---|---|---|
| Local government area | Tamworth Regional |
Median House Rental Prices by Street (1)
| Level_0 | Street | Date | Median rent (per week) |
|---|---|---|---|
| 88215 | Somerset Pl | 11 Dec 2024 | $395 |
Realtors (1)
| Headline | Place | Datetime |
|---|---|---|
| Country Auctions | 496- 500 Armidale Rd |
Turnover Rate by Street (17)
| Turnover rate | Street | Turnover Label | Turnover Years | Year |
|---|---|---|---|---|
| 92.3% | New England Hwy | high turnover | Every 10.8 years (high turnover) | 2025 |
| 150.0% | Bibil Cl | very high turnover | Every 6.7 years (very high turnover) | 2025 |
| 55.6% | Rupari Dr | quite tightly held | Every 18.0 years (quite tightly held) | 2025 |
| 75.0% | Oaklands Dr | average turnover | Every 13.3 years (average turnover) | 2025 |
| 75.0% | Back Kootingal Rd | average turnover | Every 13.3 years (average turnover) | 2025 |
Percent of Renters by Street (20)
| Percent of Renters | Street |
|---|---|
| 0.0% | Adolphus Dr |
| 19.9% | Armidale Rd |
| 12.8% | Back Kootingal Rd |
| 0.0% | Bibil Cl |
| 100.0% | Brooklyn Park Rd |
Planning Applications: Dwellings (17)
| Headline | Place | Date |
|---|---|---|
| Construction of 18m X 9m Shed with Amenities. - Tamworth Regional Council DA2025-0353 | 4 Supreme Way Nemingha NSW 2340 | 20 Mar 2025 |
| PAN-518227 - Construction of 18m X 9m Shed with Amenities. - Tamworth Regional Council DA2025-0339 | 4 Supreme Way Nemingha NSW 2340 | 13 Mar 2025 |
| S68-2025-3835 - New Single Storey Dwelling - Tamworth Regional Council LG2025-0617 | 19 Premiers Street Nemingha NSW 2340 | 10 Mar 2025 |
| S68-2025-2552 - Install New AWTS Taylex Connecting to New Single Dwelling House and Shed - Tamworth Regional Council LG2025-0548 | 7 Premiers Street Nemingha NSW 2340 | 27 Feb 2025 |
| S68-2024-21629 - New Single Storey Dwelling and AWTS - Tamworth Regional Council LG2025-0463 | New England Highway Nemingha NSW 2340 | 13 Jan 2025 |
Planning Applications: Other (13)
| Headline | Place | Date |
|---|---|---|
| PAN-496681 - Modification to DA2023-0390 Replacement Fuel Canopy & Associated Signage - Tamworth Regional Council MOD2025-0047 | 1049 Armidale Road Nemingha NSW 2340 | 12 Dec 2024 |
| PAN-479481 - MOD to DA2024-0386 - A boundary adjustment between multiple lots. - Tamworth Regional Council MOD2025-0036 | 114 Back Kootingal Road Nemingha NSW 2340 | 18 Oct 2024 |
| S68-2024-11488 - Replacement of Existing Fuel Canopy & Associated Signage - Tamworth Regional Council LG2025-0083 | 1049 Armidale Road Nemingha NSW 2340 | 25 Jul 2024 |
| S68-2024-8279 - New Dwelling with attached 8 car garage and carport - Tamworth Regional Council LG2025-0074 | 26 Premiers Street Nemingha NSW 2340 | 18 Jul 2024 |
| Liquor licence transfer - with licensee consent - on premises - NSW Independent Liquor and Gaming Authority SR0001154605 | 993-999 Armidale Rd, Nemingha NSW 2340 | 25 Oct 2023 |
Recently Sold Houses (100)
| Address | Price | Bedrooms | Bathrooms | Garage spaces | Date sold | Subdivisible into | Sale Type |
|---|---|---|---|---|---|---|---|
| 24 Somerset Pl | $480,000 | 3.0 | 1.0 | 1.0 | 24 Jan 2025 | 0 | On Market |
| 24 Somerset Pl | $480,000 | 24 Jan 2025 | 0 | On Market | |||
| 24 Somerset Pl | $380,000 | 3.0 | 1.0 | 1.0 | 22 Jan 2025 | 0 | On Market |
| 114 Back Kootingal Rd | $780,000 | 3.0 | 1.0 | 2.0 | 20 Dec 2024 | 0 | On Market |
| 1025 Armidale Rd | $440,000 | 3.0 | 1.0 | 2.0 | 04 Oct 2024 | 0 | On Market |
Businesses (27)
| Name | Address |
|---|---|
| Sean Hofman Electrical Service Provider | 1009 Armidale Rd, Nemingha NSW 2340, Australia |
| K&K Directional Drilling | 334 Nundle Rd, Nemingha NSW 2340, Australia |
| Garage Doors and More - Tamworth | 32 Railway St, Nemingha NSW 2340, Australia |
| Country Auctions | 496- 500 Armidale Rd |
| Country Auctions | 496- 500 Armidale Rd |
Accommodation Options (1)
| Name | Address |
|---|---|
| McNevins Tamworth Motel | 999 Armidale Rd, Nemingha NSW 2340, Australia |
Median House Sale Prices by Street (100)
| Street | Date | Median sale value |
|---|---|---|
| Armidale Rd | 10 May 2024 | $1,030,000 |
| Back Kootingal Rd | 10 May 2024 | $850,000 |
| Somerset Pl | 10 May 2024 | $437,500 |
| Railway St | 06 Oct 2023 | $250,000 |
| Adolphus Dr | 06 Oct 2023 | $447,500 |
Recent Rental House Listings (100)
| Address | Rent (per week) | Bedrooms | Bathrooms | Garage spaces | Date | Subdivisible into |
|---|---|---|---|---|---|---|
| 15 Adolphus Dr | Price Withheld | 4 | 2 | 2 | 09 Apr 2025 | 0 |
| 15 Adolphus Dr | Price Withheld | 4 | 2 | 2 | 09 Apr 2025 | 0 |
| 15 Adolphus Dr | Price Withheld | 4 | 2 | 2 | 09 Apr 2025 | 0 |
| 15 Adolphus Dr | Price Withheld | 4 | 2 | 2 | 09 Apr 2025 | 0 |
| 18 Johnston St | $450 | 3 | 1 | 5 | 17 Jan 2025 | 0 |
Recently Sold Units (100)
| Address | Price | Bedrooms | Bathrooms | Garage spaces | Date sold | Sale Type |
|---|---|---|---|---|---|---|
| 24 Somerset Pl | $480,000 | 24 Jan 2025 | On Market | |||
| 24 Somerset Pl | $480,000 | 24 Jan 2025 | On Market | |||
| 24 Somerset Pl | $480,000 | 24 Jan 2025 | On Market | |||
| 24 Somerset Pl | $480,000 | 24 Jan 2025 | On Market | |||
| 24 Somerset Pl | $480,000 | 24 Jan 2025 | On Market |
Recent Rental Unit Listings (100)
| Address | Rent (per week) | Bedrooms | Bathrooms | Garage spaces | Date |
|---|---|---|---|---|---|
| Unit 2, 6 Somerset Pl | $290 | 2.0 | 1.0 | 1.0 | 31 May 2024 |
| Unit 2, 6 Somerset Pl | $290 | 2.0 | 1.0 | 1.0 | 31 May 2024 |
| Unit 2, 6 Somerset Pl | $290 | 2.0 | 1.0 | 1.0 | 31 May 2024 |
| Unit 2, 6 Somerset Pl | $290 | 2.0 | 1.0 | 1.0 | 31 May 2024 |
| Unit 2, 6 Somerset Pl | $290 | 2.0 | 1.0 | 1.0 | 31 May 2024 |
Loading entities ..