.png)
Profiles
Nearby Suburbs
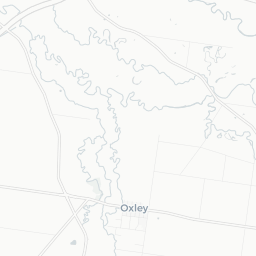
Real Estate Market: Is Oxley (Vic.) VIC 3678 a Good Suburb to Buy Into?
Housing Market in Oxley (Vic.)

Sources: Property Listings and Microburbs, 2002 - 2023
| Field | Value | VS Hume | Trend | |
|---|---|---|---|---|
| Premium | Premium | Premium | ||
| Premium | Premium | Premium | ||
| Premium | Premium | Premium | ||
| $488 | Bottom 21% |
|
||
| Premium | Premium | Premium |
Housing Supply in Oxley (Vic.)

The higher the supply score the more supply is on the market, both current and future.
Sources: ABS, GEOSPATIAL, Property Listings, PLANNING ALERTS and Microburbs, 2002 - 2023
Sources: ABS, GEOSPATIAL, Property Listings, PLANNING ALERTS and Microburbs, 2002 - 2023
Oxley (Vic.)
37.2%
Oxley (Vic.)
37.2%
Hume
36.0%
Hume
36.0%
| Field | Value | VS Hume | Trend | |
|---|---|---|---|---|
| 1,560 | Top 3% |
|
||
| 2.2 | Top 49% | Data for Jul 2023 | ||
| Premium | Premium | Premium | ||
| Premium | Premium | Premium | ||
| Premium | Premium | Premium | ||
| 2 lots | Bottom 14% |
|
||
| Premium | Premium | Premium | ||
| Premium | Premium | Premium | ||
| 2 | Top 35% | Data for Feb 2025 |
Housing Stock Quality in Oxley (Vic.)
The higher the score, the higher the quality of the houses and units.
Sources: ABS, GEOSPATIAL, Property Listings and Microburbs, 2006 - 2023
Sources: ABS, GEOSPATIAL, Property Listings and Microburbs, 2006 - 2023
| Field | Value | VS Hume | Trend | |
|---|---|---|---|---|
| 100.0% | Top 31% |
|
||
| 2.6 | Top 39% |
|
||
| 0.0% | Bottom 37% | Data for Jun 2023 |
Development Restrictions in Oxley (Vic.)

The higher the score, the more easily density can be increased.
Sources: GEOSPATIAL, TORREN, ABS and Microburbs, 2011 - 2023
Sources: GEOSPATIAL, TORREN, ABS and Microburbs, 2011 - 2023
Oxley (Vic.)
17.9%
Oxley (Vic.)
17.9%
Hume
25.1%
Hume
25.1%
| Field | Value | VS Hume | Trend | |
|---|---|---|---|---|
| 48.0 sq km | Top 22% | Data for Jan 2021 | ||
| 0.0 sq km | Top 47% | Data for Jun 2023 | ||
| 2790 sqm per resident | Top 35% | Data for Jan 2021 |
Risk in Oxley (Vic.)

The higher the score, the more exposed households are to financial stress.
Sources: ABS, Property Listings, TORREN and Microburbs, 2006 - 2023
Sources: ABS, Property Listings, TORREN and Microburbs, 2006 - 2023
Oxley (Vic.)
34.5
Oxley (Vic.)
34.5
Hume
32.1
Hume
32.1
| Field | Value | VS Hume | Trend | |
|---|---|---|---|---|
| 94.2% | Top 41% |
|
||
| 5.8% | Bottom 41% |
|
||
| 35 | Top 41% | Data for Jun 2023 | ||
| $1,350 | Bottom 21% |
|
||
| 81 | Top 31% | Data for Jun 2023 | ||
| 82 | Top 15% | Data for Jun 2023 | ||
| 18.6% | Bottom 31% |
|
||
| 47.4% | Top 27% |
|
Housing Demand in Oxley (Vic.)
The higher the score, the more demand their is for housing in the area, both current and future.
Sources: ABS, TORREN, Property Listings and Microburbs, 2006 - 2030
Sources: ABS, TORREN, Property Listings and Microburbs, 2006 - 2030
Oxley (Vic.)
40.2%
Oxley (Vic.)
40.2%
Hume
49.4%
Hume
49.4%
| Field | Value | VS Hume | Trend | |
|---|---|---|---|---|
| Premium | Premium | Premium | ||
| Premium | Premium | Premium | ||
| 10200 | Bottom 40% |
|
||
| 48700 | Bottom 33% |
|
||
| Premium | Premium | Premium | ||
| 30700 | Top 36% |
|
||
| Premium | Premium | Premium | ||
| Premium | Premium | Premium | ||
| Premium | Premium | Premium |
Unit Market in Oxley (Vic.)
Sources: Property Listings and Microburbs, 2002 - 2023
| Field | Value | VS Hume | Trend | |
|---|---|---|---|---|
| Premium | Premium | Premium | ||
| $230 | Bottom 0% |
|
||
| Premium | Premium | Premium | ||
| 136.0% | Top 4% |
|
Planning Applications: Dwellings (10)
| Headline | Place | Date |
|---|---|---|
| Five (5) lot subdivision to create four vacant lots and one lot containing an existing dwelling - Streamlined Planning through Electronic Applications and Referrals S236002A | 15 Gibb Street, Oxley VIC 3678 | 20 Sep 2024 |
| Demolition of domestic outbuildings, buildings and works for the construction of two dwellings and subdivision of land into 3 lots - Rural City of Wangaratta PlnApp24/123 | 1188 Green Street Oxley VIC 3678 | 09 Aug 2024 |
| Planning approval is sought for subdivision of the subject land into two (2) lots. The proposed layout facilitates the logical progression of infill development and associated infrastructure provision accessed via Shadforth Street. There is no existing dwelling on site, however there are four existing sheds that are proposed to be removed from the site, leaving proposed Lots 1-2 clear of structures. It is planned that proposed Lots 1-2 will be made available to the open land supply market. No vegetation on site is deemed to be affected by the proposal thus, there is no requirement for the removal of native vegetation. - Streamlined Planning through Electronic Applications and Referrals S221752V | 79 Ely Street, Oxley VIC 3678 | 03 Dec 2023 |
| Planning approval is sought for subdivision of the subject land into two (2) lots. The proposed layout facilitates the logical progression of infill development and associated infrastructure provision accessed via Ely Street and Shadforth Street. The existing dwelling is to be situated within proposed Lot 1. Three existing sheds are proposed to be removed from the site, leaving proposed Lot 2 clear of structures, with the balance of the sheds on proposed Lot 1 to remain in situ. It is planned that proposed Lot 1 will be retained for the current land holder, with proposed Lot 2 being made available to the open land supply market. No vegetation on site is deemed to be affected by the proposal thus, there is no requirement for the removal of native vegetation. - Streamlined Planning through Electronic Applications and Referrals S220683S | 79 Ely Street, Oxley VIC 3678 | 26 Oct 2023 |
| Buildings and works for the construction of a dwelling and associated outbuilding - Rural City of Wangaratta PlnApp23/157 | 36 Jones Street Oxley VIC 3678 | 11 Oct 2023 |
Planning Applications: Other (5)
| Headline | Place | Date |
|---|---|---|
| Use of land for a licensed premises (Remote Sellers Liquor License) - Rural City of Wangaratta PlnApp22/223 | 80 Gehrigs Lane Oxley VIC 3678 | 17 Nov 2022 |
| Certification of a Plan - Streamlined Planning through Electronic Applications and Referrals S161951T | 27 Ely Street, Oxley VIC 3678 | 31 Jul 2020 |
| Certification of a Plan - Streamlined Planning through Electronic Applications and Referrals S161472V | Jones Street, Oxley VIC 3678 | 20 Jul 2020 |
| Certification of a Plan - Streamlined Planning through Electronic Applications and Referrals S161476C | 15 Jones Street, Oxley VIC 3678 | 20 Jul 2020 |
| Certification of a Plan - Streamlined Planning through Electronic Applications and Referrals S158359V | 23 Macartney Street, Oxley VIC 3678 | 20 May 2020 |
LGA Details (1)
| Headline | Place | Datetime |
|---|---|---|
| Local government area | Wangaratta |
Median House Rental Prices by Street (1)
| Level_0 | Street | Date | Median rent (per week) |
|---|---|---|---|
| 102998 | Johnson St | 13 Mar 2025 | $650 |
Percent of Renters by Street (24)
| Percent of Renters | Street |
|---|---|
| 1.4% | Ely St |
| 0.0% | Bookless Ct |
| 0.0% | Faithful St |
| 0.0% | Green St |
| 0.0% | Gehrigs Ln |
Turnover Rate by Street (23)
| Turnover rate | Street | Turnover Label | Turnover Years | Year |
|---|---|---|---|---|
| 71.4% | Macartney St | average turnover | Every 14.0 years (average turnover) | 2025 |
| 50.0% | Wangaratta-Whitfield Rd | very tightly held | Every 20.0 years (very tightly held) | 2025 |
| 95.5% | Johnson St | high turnover | Every 10.5 years (high turnover) | 2025 |
| 119.2% | Ely St | very high turnover | Every 8.4 years (very high turnover) | 2025 |
| 200.0% | Oxley Plains Rd | very high turnover | Every 5.0 years (very high turnover) | 2025 |
Businesses (5)
| Name | Address |
|---|---|
| Cook's Earthmoving & Laser Landforming PTY LTD | 922 Wangaratta-Whitfield Rd, Oxley VIC 3678, Australia |
| Cook's Earthmoving & Laser Land Forming Pty Ltd | 922, Wangaratta Whitfield Rd |
| Cook's Earthmoving & Laser Land Forming Pty Ltd | 922, Wangaratta Whitfield Rd |
| Cook's Earthmoving & Laser Land Forming Pty Ltd | 922, Wangaratta Whitfield Rd |
| Oxley Slashing & Rotary Hoe Hire | Ely St |
Recently Sold Houses (100)
| Address | Price | Bedrooms | Bathrooms | Garage spaces | Date sold | Subdivisible into | Sale Type |
|---|---|---|---|---|---|---|---|
| 15 Jones St | Price Withheld | 3.0 | 2.0 | 2.0 | 10 Jan 2025 | 0 | On Market |
| 15 Jones St | $650,000 | 3.0 | 2.0 | 2.0 | 10 Jan 2025 | 0 | On Market |
| 37 Jones St | $695,000 | 3.0 | 2.0 | 08 Nov 2024 | 0 | On Market | |
| 37 Jones St | Price Withheld | 3.0 | 2.0 | 2.0 | 08 Nov 2024 | 0 | On Market |
| 37 Jones St | Price Withheld | 3.0 | 2.0 | 08 Nov 2024 | 0 | On Market |
Median House Sale Prices by Street (100)
| Street | Date | Median sale value |
|---|---|---|
| Johnson St | 10 May 2024 | $762,500 |
| Ely St | 10 May 2024 | $905,000 |
| Oxley-Greta West Rd | 10 May 2024 | $912,500 |
| Wangaratta-Whitfield Rd | 25 Apr 2024 | $1,438,000 |
| Jones St | 10 Apr 2024 | $727,500 |
Recent Rental Unit Listings (100)
| Address | Rent (per week) | Bedrooms | Bathrooms | Garage spaces | Date |
|---|---|---|---|---|---|
| Unit 1, 41 Shadforth St | $350 | 2.0 | 1.0 | 1.0 | 22 Oct 2024 |
| Unit 1, 41 Shadforth St | $350 | 2.0 | 1.0 | 1.0 | 22 Oct 2024 |
| Unit 1, 41 Shadforth St | $350 | 2.0 | 1.0 | 1.0 | 22 Oct 2024 |
| Unit 1, 41 Shadforth St | $350 | 2.0 | 1.0 | 1.0 | 22 Oct 2024 |
| Unit 1, 41 Shadforth St | $350 | 2.0 | 1.0 | 1.0 | 22 Oct 2024 |
Recent Rental House Listings (100)
| Address | Rent (per week) | Bedrooms | Bathrooms | Garage spaces | Date | Subdivisible into |
|---|---|---|---|---|---|---|
| 70c Johnson St | $550 | 3 | 2 | 2 | 22 Jan 2025 | 0 |
| 70c Johnson St | $550 | 3 | 2 | 2 | 22 Jan 2025 | 0 |
| 70c Johnson St | $550 | 3 | 2 | 2 | 22 Jan 2025 | 0 |
| 70c Johnson St | $550 | 3 | 2 | 2 | 22 Jan 2025 | 0 |
| 70c Johnson St | $550 | 3 | 2 | 2 | 22 Jan 2025 | 0 |
Recently Sold Units (100)
| Address | Price | Bedrooms | Bathrooms | Garage spaces | Date sold | Sale Type |
|---|---|---|---|---|---|---|
| 27 Ely St | $950,000 | 4.0 | 2.0 | 2.0 | 08 Feb 2024 | On Market |
| 27 Ely St | $950,000 | 4.0 | 2.0 | 2.0 | 08 Feb 2024 | On Market |
| 27 Ely St | $950,000 | 4.0 | 2.0 | 2.0 | 08 Feb 2024 | On Market |
| 27 Ely St | $950,000 | 4.0 | 2.0 | 2.0 | 08 Feb 2024 | On Market |
| 27 Ely St | $950,000 | 4.0 | 2.0 | 2.0 | 08 Feb 2024 | On Market |
Loading entities ..