.png)
Profiles
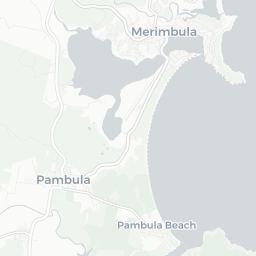
Nearby Suburbs
Real Estate Market: Is Pambula Beach NSW 2549 a Good Suburb to Buy Into?
Housing Market in Pambula Beach

Sources: Property Listings, TORREN and Microburbs, 2002 - 2023
| Field | Value | VS Capital Region | Trend | |
|---|---|---|---|---|
| Premium | Premium | Premium | ||
| Premium | Premium | Premium | ||
| Premium | Premium | Premium | ||
| $652 | Top 32% |
|
||
| Premium | Premium | Premium |
Housing Supply in Pambula Beach

The higher the supply score the more supply is on the market, both current and future.
Sources: ABS, GEOSPATIAL, Property Listings, PLANNING ALERTS, BASIX and Microburbs, 2002 - 2031
Sources: ABS, GEOSPATIAL, Property Listings, PLANNING ALERTS, BASIX and Microburbs, 2002 - 2031
Pambula Beach
57.5%
Pambula Beach
57.5%
Capital Region
40.2%
Capital Region
40.2%
| Field | Value | VS Capital Region | Trend | |
|---|---|---|---|---|
| 649 | Top 7% |
|
||
| 3.5 | Top 38% | Data for Jul 2023 | ||
| 61.2 | Top 11% | Data for May 2023 | ||
| Premium | Premium | Premium | ||
| Premium | Premium | Premium | ||
| Premium | Premium | Premium | ||
| 13 | Bottom 47% |
|
||
| Premium | Premium | Premium | ||
| Premium | Premium | Premium | ||
| Premium | Premium | Premium | ||
| 0 | Bottom 24% | Data for Feb 2025 |
Housing Stock Quality in Pambula Beach
The higher the score, the higher the quality of the houses and units.
Sources: ABS, GEOSPATIAL, Property Listings, BASIX and Microburbs, 2006 - 2023
Sources: ABS, GEOSPATIAL, Property Listings, BASIX and Microburbs, 2006 - 2023
| Field | Value | VS Capital Region | Trend | |
|---|---|---|---|---|
| 82.9% | Bottom 14% | 0 to Jan 2021 | ||
| 2.1 | Bottom 20% |
|
||
| 2.9% | Top 19% | Data for Jun 2023 | ||
| Premium | Premium | Premium |
Development Restrictions in Pambula Beach

The higher the score, the more easily density can be increased.
Sources: GEOSPATIAL, TORREN, ABS and Microburbs, 2011 - 2023
Sources: GEOSPATIAL, TORREN, ABS and Microburbs, 2011 - 2023
Pambula Beach
27.3%
Pambula Beach
27.3%
Capital Region
30.5%
Capital Region
30.5%
| Field | Value | VS Capital Region | Trend | |
|---|---|---|---|---|
| 6.3 sq km | Bottom 46% | Data for Jan 2021 | ||
| 0.54 | Bottom 26% | Data for Feb 2023 | ||
| 22.7% | Top 5% | Data for Jun 2023 | ||
| 0 | Bottom 16% | Data for Jun 2023 | ||
| 1140 sqm per resident | Bottom 46% | Data for Jan 2021 |
Risk in Pambula Beach

The higher the score, the more exposed households are to financial stress.
Sources: ABS, Property Listings, TORREN and Microburbs, 2006 - 2023
Sources: ABS, Property Listings, TORREN and Microburbs, 2006 - 2023
Pambula Beach
37.5
Pambula Beach
37.5
Capital Region
36.5
Capital Region
36.5
| Field | Value | VS Capital Region | Trend | |
|---|---|---|---|---|
| 88.0% | Bottom 36% |
|
||
| 12.0% | Top 36% |
|
||
| 59 | Top 7% | Data for Jun 2023 | ||
| $2,080 | Top 41% |
|
||
| 70 | Bottom 11% | Data for Jun 2023 | ||
| 66 | Bottom 10% | Data for Jun 2023 | ||
| 27.6% | Top 23% |
|
||
| 27.6% | Bottom 20% |
|
Housing Demand in Pambula Beach
The higher the score, the more demand their is for housing in the area, both current and future.
Sources: ABS, TORREN, Property Listings and Microburbs, 2004 - 2030
Sources: ABS, TORREN, Property Listings and Microburbs, 2004 - 2030
Pambula Beach
53.7%
Pambula Beach
53.7%
Capital Region
56.9%
Capital Region
56.9%
| Field | Value | VS Capital Region | Trend | |
|---|---|---|---|---|
| Premium | Premium | Premium | ||
| 13500 | Top 42% |
|
||
| 77400 | Top 39% |
|
||
| Premium | Premium | Premium | ||
| 36500 | Top 33% |
|
||
| Premium | Premium | Premium | ||
| Premium | Premium | Premium | ||
| Premium | Premium | Premium |
Unit Market in Pambula Beach
Sources: Property Listings and Microburbs, 2002 - 2023
| Field | Value | VS Capital Region | Trend | |
|---|---|---|---|---|
| Premium | Premium | Premium | ||
| $486 | Top 42% |
|
||
| Premium | Premium | Premium | ||
| 60.8% | Bottom 22% |
|
LGA Details (1)
| Headline | Place | Datetime |
|---|---|---|
| Local government area | Bega Valley |
Median House Rental Prices by Street (3)
| Level_0 | Street | Date | Median rent (per week) |
|---|---|---|---|
| 91203 | Culgoa Cr | 13 Mar 2025 | $700 |
| 91343 | Jinjera Pde | 13 Mar 2025 | $665 |
| 91467 | Pambula Beach Rd | 13 Mar 2025 | $607 |
Accommodation Options (4)
| Headline | Place | Datetime |
|---|---|---|
| Holiday Hub Beach Resort | Pambula Beach Rd | |
| Beachside Units | 11 Coraki Dr | |
Percent of Renters by Street (12)
| Percent of Renters | Street |
|---|---|
| 10.1% | Booroo St |
| 35.1% | Coraki Dr |
| 27.3% | Culgoa Cr |
| 7.9% | Curragudde Cl |
| 23.0% | Gwainurra Gr |
Median Unit Sale Prices by Street (100)
| Date | Median sale value | Street |
|---|---|---|
| 31 May 2024 | 902000.0 | Booroo St |
| 31 May 2024 | 622700.0 | Culgoa Cr |
| 31 May 2024 | 735600.0 | Jinjera Pde |
| 31 May 2024 | 1285000.0 | Pambula Beach Rd |
| 31 May 2024 | 1288000.0 | Winnunga St |
Turnover Rate by Street (11)
| Turnover rate | Street | Turnover Label | Turnover Years | Year |
|---|---|---|---|---|
| 69.0% | Jinjera Pde | average turnover | Every 14.5 years (average turnover) | 2025 |
| 100.0% | Weemilah Dr | high turnover | Every 10.0 years (high turnover) | 2025 |
| 70.0% | Coraki Dr | average turnover | Every 14.3 years (average turnover) | 2025 |
| 76.3% | Culgoa Cr | average turnover | Every 13.1 years (average turnover) | 2025 |
| 67.4% | Pambula Beach Rd | average turnover | Every 14.8 years (average turnover) | 2025 |
Recently Sold Houses (100)
| Address | Price | Bedrooms | Bathrooms | Garage spaces | Date sold | Subdivisible into | Sale Type |
|---|---|---|---|---|---|---|---|
| 19 Pambula Beach Rd | $930,000 | 4.0 | 2.0 | 2.0 | 06 Feb 2025 | 0 | On Market |
| 3 Coraki Dr | $2,650,000 | 3.0 | 3.0 | 2.0 | 01 Jan 2025 | 0 | On Market |
| 59 Culgoa Cr | $890,000 | 4.0 | 2.0 | 2.0 | 09 Dec 2024 | 0 | On Market |
| Unit 1, 22 Culgoa Cr | $740,000 | 2.0 | 1.0 | 1.0 | 09 Dec 2024 | 0 | On Market |
| 19 Jinjera Pde | $980,000 | 3.0 | 2.0 | 2.0 | 20 Nov 2024 | 0 | On Market |
Planning Applications: Dwellings (29)
| Headline | Place | Date |
|---|---|---|
| Alterations & addition to exist dwelling, decks & erection of a studio - Bega Valley Shire Council 10-2024-124-1 | 25 Jinjera Pde, Pambula Beach NSW 2549 | 19 Jul 2024 |
| Alterations to existing education facility, a secondary storey addition over existing classrooms and associated outdoor covered areas. - NSW Sydney and Regional Planning Panels PPSSTH-350 | 64 Culgoa Crescent Pambula Beach 2549, NSW | 16 Apr 2024 |
| Alterations & additions to dwelling inc demoliton & new swimming pool - Bega Valley Shire Council 10-2024-39-1 | 96 Coraki Dr, Pambula Beach NSW 2549 | 07 Mar 2024 |
| Demolition and erection 2 storey dwelling and swimming pool - Bega Valley Shire Council 10-2023-241-1 | 9 Weemilah Dr, Pambula Beach NSW 2549 | 08 Nov 2023 |
| Alterations and additions to existing multi storey dwelling - Bega Valley Shire Council 10-2023-77-1 | 56 Coraki Dr, Pambula Beach NSW 2549 | 09 May 2023 |
Planning Applications: Other (10)
| Headline | Place | Date |
|---|---|---|
| Addition over existing classrooms and associated outdoor covered - Bega Valley Shire Council 10-2023-299-1 | Pambula Beach Rd, Pambula Beach NSW 2549 | 20 Dec 2023 |
| Liquor licence transfer - with licensee consent - on premises - NSW Independent Liquor and Gaming Authority SR0000953222 | Pambula Beach Rd, Pambula Beach NSW 2549 | 27 Oct 2022 |
| Liquor licence transfer - with licensee consent - limited - NSW Independent Liquor and Gaming Authority SR0000767557 | Pambula Beach Surf Life Saving Club Pambula Beach Rd, Pambula NSW 2549 | 23 Dec 2021 |
| Add two additional windows - Bega Valley Shire Council 010.2021.00000257.002 | 45 Jinjera Pde, Pambula Beach, NSW 2549 | 20 Oct 2021 |
| Regularise Unauthorised internal works to 2 Units to combine into 1 - Bega Valley Shire Council 010.2021.00001207.001 | 11 Coraki Dr, Pambula Beach, NSW 2549 | 15 Oct 2021 |
Businesses (8)
| Name | Address |
|---|---|
| Coastal Builders NSW Pty Ltd | 2 Winnunga St, Pambula Beach NSW 2549, Australia |
| Ricky Holt Plumbing | 44 Pambula Beach Rd, Pambula Beach NSW 2549, Australia |
| David Schwager Builders | |
| David Schwager Builders | |
| David Schwager Builders |
Median House Sale Prices by Street (100)
| Street | Date | Median sale value |
|---|---|---|
| Jinjera Pde | 10 May 2024 | $1,020,000 |
| Culgoa Cr | 10 May 2024 | $899,000 |
| Curragudde Cl | 10 May 2024 | $1,475,000 |
| Pambula Beach Rd | 10 May 2024 | $907,500 |
| Gwainurra Gr | 10 May 2024 | $1,625,000 |
Recent Rental Unit Listings (100)
| Address | Rent (per week) | Bedrooms | Bathrooms | Garage spaces | Date |
|---|---|---|---|---|---|
| Unit 1, 18 Curragudde Cl | $600 | 2.0 | 2.0 | 1.0 | 16 Jul 2024 |
| Unit 1, 18 Curragudde Cl | $600 | 2.0 | 2.0 | 1.0 | 16 Jul 2024 |
| Unit 1, 18 Curragudde Cl | $600 | 2.0 | 2.0 | 1.0 | 16 Jul 2024 |
| Unit 1, 18 Curragudde Cl | $600 | 2.0 | 2.0 | 1.0 | 16 Jul 2024 |
| Unit 1, 18 Curragudde Cl | $600 | 2.0 | 2.0 | 1.0 | 16 Jul 2024 |
Recent Rental House Listings (100)
| Address | Rent (per week) | Bedrooms | Bathrooms | Garage spaces | Date | Subdivisible into |
|---|---|---|---|---|---|---|
| 47 Culgoa Cr | $800 | 4 | 2 | 2 | 17 Jan 2025 | 0 |
| 47 Culgoa Cr | $800 | 4 | 2 | 2 | 17 Jan 2025 | 0 |
| 47 Culgoa Cr | $800 | 4 | 2 | 2 | 17 Jan 2025 | 0 |
| 47 Culgoa Cr | $800 | 4 | 2 | 2 | 17 Jan 2025 | 0 |
| 47 Culgoa Cr | $800 | 4 | 2 | 2 | 17 Jan 2025 | 0 |
Recently Sold Units (100)
| Address | Price | Bedrooms | Bathrooms | Garage spaces | Date sold | Sale Type |
|---|---|---|---|---|---|---|
| Unit 1, 22 Culgoa Cr | $740,000 | 2.0 | 1.0 | 1.0 | 09 Dec 2024 | On Market |
| Unit 1, 22 Culgoa Cr | $740,000 | 2.0 | 1.0 | 1.0 | 09 Dec 2024 | On Market |
| Unit 1, 22 Culgoa Cr | $740,000 | 2.0 | 1.0 | 1.0 | 09 Dec 2024 | On Market |
| Unit 1, 22 Culgoa Cr | $740,000 | 2.0 | 1.0 | 1.0 | 09 Dec 2024 | On Market |
| Unit 1, 22 Culgoa Cr | $740,000 | 2.0 | 1.0 | 1.0 | 09 Dec 2024 | On Market |
Loading entities ..