.png)
Profiles
Nearby Suburbs
Real Estate Market: Is Pirlangimpi NT 0822 a Good Suburb to Buy Into?
Housing Supply in Pirlangimpi

The higher the supply score the more supply is on the market, both current and future.
Sources: ABS, GEOSPATIAL and Microburbs, 2002 - 2023
Sources: ABS, GEOSPATIAL and Microburbs, 2002 - 2023
Pirlangimpi
60.9%
Pirlangimpi
60.9%
Northern Territory
58.4%
Northern Territory
58.4%
| Field | Value | VS Northern Territory | Trend | |
|---|---|---|---|---|
| 0 | Bottom 38% | Data for Jun 2025 | ||
| 5.0 | Top 30% | Data for Jul 2023 | ||
| Premium | Premium | Premium |
Housing Stock Quality in Pirlangimpi
The higher the score, the higher the quality of the houses and units.
Sources: ABS, GEOSPATIAL and Microburbs, 2006 - 2023
Sources: ABS, GEOSPATIAL and Microburbs, 2006 - 2023
| Field | Value | VS Northern Territory | Trend | |
|---|---|---|---|---|
| 86.6% | Bottom 17% |
|
||
| 3.1 | Top 8% |
|
||
| 0.0% | Bottom 37% | Data for Jun 2023 |
Development Restrictions in Pirlangimpi

The higher the score, the more easily density can be increased.
Sources: GEOSPATIAL, TORREN, ABS and Microburbs, 2011 - 2023
Sources: GEOSPATIAL, TORREN, ABS and Microburbs, 2011 - 2023
Pirlangimpi
25.9%
Pirlangimpi
25.9%
Northern Territory
29.6%
Northern Territory
29.6%
| Field | Value | VS Northern Territory | Trend | |
|---|---|---|---|---|
| 12.0 sq km | Top 43% | Data for Jan 2021 | ||
| 59600 sqm per resident | Top 5% | Data for Jan 2021 |
Risk in Pirlangimpi

The higher the score, the more exposed households are to financial stress.
Sources: ABS, Property Listings, TORREN and Microburbs, 2006 - 2023
Sources: ABS, Property Listings, TORREN and Microburbs, 2006 - 2023
Pirlangimpi
49.7%
Pirlangimpi
49.7%
Northern Territory
53.0%
Northern Territory
53.0%
| Field | Value | VS Northern Territory | Trend | |
|---|---|---|---|---|
| 25 | Bottom 24% | Data for Jun 2023 | ||
| 82 | Top 25% | Data for Jun 2023 | ||
| 79 | Top 28% | Data for Jun 2023 | ||
| 0.0% | Bottom 6% | Data for Jan 2021 |
Housing Demand in Pirlangimpi
The higher the score, the more demand their is for housing in the area, both current and future.
Sources: ABS, TORREN and Microburbs, 2006 - 2030
Sources: ABS, TORREN and Microburbs, 2006 - 2030
Pirlangimpi
31.9%
Pirlangimpi
31.9%
Northern Territory
35.1%
Northern Territory
35.1%
| Field | Value | VS Northern Territory | Trend | |
|---|---|---|---|---|
| Premium | Premium | Premium | ||
| Premium | Premium | Premium | ||
| 18300 | Bottom 7% |
|
||
| Premium | Premium | Premium | ||
| 2680 | Bottom 22% |
|
||
| Premium | Premium | Premium |
LGA Details (1)
| Headline | Place | Datetime |
|---|---|---|
| Local government area | Tiwi Islands |
Businesses (1)
| Name | Address |
|---|---|
| Munupi Art Centre | Pirlangimpi Cmmn |
Loading entities ..


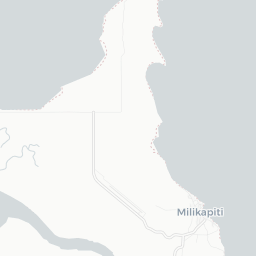

Nearby Suburbs