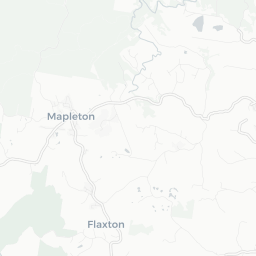
.png)
Profiles
Nearby Suburbs
Real Estate Market: Is Point Arkwright QLD 4573 a Good Suburb to Buy Into?
Housing Market in Point Arkwright

Sources: Property Listings and Microburbs, 2002 - 2023
| Field | Value | VS Sunshine Coast | Trend | |
|---|---|---|---|---|
| Premium | Premium | Premium | ||
| Premium | Premium | Premium | ||
| Premium | Premium | Premium | ||
| $900 | Top 8% |
|
||
| Premium | Premium | Premium |
Housing Supply in Point Arkwright

The higher the supply score the more supply is on the market, both current and future.
Sources: ABS, GEOSPATIAL, Property Listings, PLANNING ALERTS and Microburbs, 2002 - 2023
Sources: ABS, GEOSPATIAL, Property Listings, PLANNING ALERTS and Microburbs, 2002 - 2023
Point Arkwright
37.6%
Point Arkwright
37.6%
Sunshine Coast
33.9%
Sunshine Coast
33.9%
| Field | Value | VS Sunshine Coast | Trend | |
|---|---|---|---|---|
| 0 | Bottom 38% | Data for Jun 2025 | ||
| 0.0 | Bottom 10% | Data for Jul 2023 | ||
| Premium | Premium | Premium | ||
| Premium | Premium | Premium | ||
| Premium | Premium | Premium | ||
| Premium | Premium | Premium | ||
| Premium | Premium | Premium | ||
| 1 | Top 40% |
|
Housing Stock Quality in Point Arkwright
The higher the score, the higher the quality of the houses and units.
Sources: ABS, GEOSPATIAL, Property Listings and Microburbs, 2006 - 2023
Sources: ABS, GEOSPATIAL, Property Listings and Microburbs, 2006 - 2023
| Field | Value | VS Sunshine Coast | Trend | |
|---|---|---|---|---|
| 63.9% | Bottom 6% |
|
||
| 2.2 | Bottom 26% |
|
||
| 90.4% | Top 3% | Data for Jun 2023 |
Development Restrictions in Point Arkwright

The higher the score, the more easily density can be increased.
Sources: GEOSPATIAL, TORREN, ABS and Microburbs, 2011 - 2023
Sources: GEOSPATIAL, TORREN, ABS and Microburbs, 2011 - 2023
Point Arkwright
39.4%
Point Arkwright
39.4%
Sunshine Coast
41.2%
Sunshine Coast
41.2%
| Field | Value | VS Sunshine Coast | Trend | |
|---|---|---|---|---|
| 0.4 sq km | Bottom 2% | Data for Jan 2021 | ||
| 0.0 sq km | Bottom 39% | Data for Jun 2023 | ||
| 1240 sqm per resident | Bottom 48% | Data for Jan 2021 |
Risk in Point Arkwright

The higher the score, the more exposed households are to financial stress.
Sources: ABS, Property Listings, TORREN and Microburbs, 2006 - 2023
Sources: ABS, Property Listings, TORREN and Microburbs, 2006 - 2023
Point Arkwright
68.4%
Point Arkwright
68.4%
Sunshine Coast
67.4%
Sunshine Coast
67.4%
| Field | Value | VS Sunshine Coast | Trend | |
|---|---|---|---|---|
| 87.6% | Bottom 34% | 0 to May 2023 | ||
| 12.4% | Top 34% |
|
||
| 69 | Top 3% | Data for Jun 2023 | ||
| $2,890 | Top 12% |
|
||
| 62 | Bottom 3% | Data for Jun 2023 | ||
| 57 | Bottom 3% | Data for Jun 2023 | ||
| 32.7% | Top 10% |
|
||
| 29.6% | Bottom 24% |
|
Housing Demand in Point Arkwright
The higher the score, the more demand their is for housing in the area, both current and future.
Sources: ABS, TORREN, Property Listings and Microburbs, 1975 - 2030
Sources: ABS, TORREN, Property Listings and Microburbs, 1975 - 2030
Point Arkwright
79.6%
Point Arkwright
79.6%
Sunshine Coast
80.6%
Sunshine Coast
80.6%
| Field | Value | VS Sunshine Coast | Trend | |
|---|---|---|---|---|
| Premium | Premium | Premium | ||
| 19000 | Top 15% |
|
||
| 66800 | Top 48% |
|
||
| Premium | Premium | Premium | ||
| 413000 | Top 1% |
|
||
| Premium | Premium | Premium | ||
| Premium | Premium | Premium | ||
| Premium | Premium | Premium |
Unit Market in Point Arkwright
Sources: Property Listings and Microburbs, 2002 - 2023
| Field | Value | VS Sunshine Coast | Trend | |
|---|---|---|---|---|
| Premium | Premium | Premium | ||
| Premium | Premium | Premium | ||
| Premium | Premium | Premium | ||
| $689 | Top 19% |
|
||
| Premium | Premium | Premium | ||
| 69.7% | Bottom 46% |
|
Planning Applications: Dwellings (5)
| Headline | Place | Date |
|---|---|---|
| Dwelling House - Zach and Kristy Elford - Brennan Planning Pty Ltd (COMBINED CAR23/0149) - Sunshine Coast Regional Council MCU23/0052 | 7 Bertya Pl Point Arkwright | 10 Mar 2023 |
| Dwelling House - Stuart and Debbie Gordon - Core Building Certification Pty Ltd - Sunshine Coast Regional Council MCU22/0416 | 1556 David Low Way Point Arkwright | 23 Dec 2022 |
| Generally In Accordance - Dual Occupancy - Jane McDonald - Adapt Town Planning and Development Management - Sunshine Coast Regional Council MCU20/0169.01 | 5 Edward St Point Arkwright | 14 Mar 2021 |
| Drainage Work, Earthworks, Landscaping, Stormwater, Vegetation Clearing and Vehicle Crossover - Dual Occupancy - Jane McDonald - Adapt Town Planning and Development Management COMBINED MCU20/0169 - Sunshine Coast Regional Council OPW20/0292 | 5 Edward St Point Arkwright | 18 Jun 2020 |
| Dual Occupancy - Jane McDonald - Adapt Town Planning and Development Management COMBINED OPW20/0292 - Sunshine Coast Regional Council MCU20/0169 | 5 Edward St Point Arkwright | 18 Jun 2020 |
Planning Applications: Other (3)
| Headline | Place | Date |
|---|---|---|
| Generally in Accordance - Suncoast Building Approvals (MCU20/0169) - Sunshine Coast Regional Council MCU20/0169.02 | 5 Edward St Point Arkwright | 13 Jan 2023 |
| BFP for Dual Occupancy - Survey Plan SP330322 (2 Lots) - Max Watterson & Associates - Sunshine Coast Regional Council POS22/0194 | 6 Dewar St Point Arkwright | 05 Nov 2022 |
| Change to Development Approval - Stage 1 Extension to Educational Establishment - Lutheran Church of Australia Queensland District - Project Urban - Sunshine Coast Regional Council MCU18/0096.04 | Luther Heights Youth Camp 1592-1606 David Low Way Point Arkwright | 10 Nov 2021 |
Businesses (1)
| Name | Address |
|---|---|
| External Works Landscaping | 58, Neurum Rd |
LGA Details (1)
| Headline | Place | Datetime |
|---|---|---|
| Local government area | Sunshine Coast |
Median House Rental Prices by Street (1)
| Level_0 | Street | Date | Median rent (per week) |
|---|---|---|---|
| 141325 | Neurum Rd | 11 Apr 2025 | $1,025 |
Percent of Renters by Street (11)
| Percent of Renters | Street |
|---|---|
| 0.0% | Bertya Pl |
| 46.7% | Andrew St |
| 0.0% | David Low None |
| 25.0% | Arthur St |
| 26.2% | David Low Way |
Turnover Rate by Street (9)
| Turnover rate | Street | Turnover Label | Turnover Years | Year |
|---|---|---|---|---|
| 63.6% | Neurum Rd | quite tightly held | Every 15.7 years (quite tightly held) | 2025 |
| 53.3% | Arthur St | quite tightly held | Every 18.8 years (quite tightly held) | 2025 |
| 80.0% | Edward St | average turnover | Every 12.5 years (average turnover) | 2025 |
| 75.6% | David Low Way | average turnover | Every 13.2 years (average turnover) | 2025 |
| 82.1% | Andrew St | average turnover | Every 12.2 years (average turnover) | 2025 |
Median Unit Sale Prices by Street (91)
| Date | Median sale value | Street |
|---|---|---|
| 10 May 2024 | $2,825,000 | Jubilee Esp |
| 31 May 2024 | 1282000.0 | Andrew St |
| 31 May 2024 | 1122000.0 | David Low Way |
| 30 Jun 2024 | 1174000.0 | Andrew St |
| 31 May 2024 | 2400000.0 | Jubilee Esp |
Recently Sold Houses (69)
| Address | Price | Bedrooms | Bathrooms | Garage spaces | Date sold | Subdivisible into | Sale Type |
|---|---|---|---|---|---|---|---|
| 80 Neurum Rd | $1,700,000 | 4.0 | 2.0 | 2.0 | 15 Oct 2024 | 0 | On Market |
| 2 Jubilee Esp | $3,235,000 | 3.0 | 2.0 | 2.0 | 24 Sep 2024 | 0 | On Market |
| 7 Meri Ct | $1,880,000 | 5.0 | 4.0 | 2.0 | 24 Aug 2024 | 0 | On Market |
| 7 Meri Ct | Price Withheld | 5.0 | 4.0 | 2.0 | 24 Aug 2024 | 0 | On Market |
| 32 Neurum Rd | $1,080,000 | 3.0 | 1.0 | 1.0 | 20 Jan 2024 | 0 | On Market |
Median House Sale Prices by Street (100)
| Street | Date | Median sale value |
|---|---|---|
| David Low Way | 30 Jun 2024 | 1306000.0 |
| Neurum Rd | 10 May 2024 | $1,135,000 |
| David Low | 25 Apr 2024 | $1,150,000 |
| Andrew St | 31 May 2024 | 1796000.0 |
| Arthur St | 31 May 2024 | 1411000.0 |
Recent Rental House Listings (100)
| Address | Rent (per week) | Bedrooms | Bathrooms | Garage spaces | Date | Subdivisible into |
|---|---|---|---|---|---|---|
| 1568 David Low Way | $1,200 | 3 | 2 | 2 | 06 Jan 2025 | 0 |
| 1568 David Low Way | $1,200 | 3 | 2 | 2 | 06 Jan 2025 | 0 |
| 1568 David Low Way | $1,200 | 3 | 2 | 2 | 06 Jan 2025 | 0 |
| 1568 David Low Way | $1,200 | 3 | 2 | 2 | 06 Jan 2025 | 0 |
| 1568 David Low Way | $1,200 | 3 | 2 | 2 | 06 Jan 2025 | 0 |
Recent Rental Unit Listings (100)
| Address | Rent (per week) | Bedrooms | Bathrooms | Garage spaces | Date |
|---|---|---|---|---|---|
| 7a Arthur St | $650 | 1.0 | 1.0 | 1.0 | 27 Mar 2025 |
| 7a Arthur St | $650 | 1.0 | 1.0 | 1.0 | 27 Mar 2025 |
| 7a Arthur St | $650 | 1.0 | 1.0 | 1.0 | 27 Mar 2025 |
| 7a Arthur St | $650 | 1.0 | 1.0 | 1.0 | 27 Mar 2025 |
| 7a Arthur St | $650 | 1.0 | 1.0 | 1.0 | 27 Mar 2025 |
Recently Sold Units (100)
| Address | Price | Bedrooms | Bathrooms | Garage spaces | Date sold | Sale Type |
|---|---|---|---|---|---|---|
| Unit 2, 1539 David Low Way | $801,000 | 2.0 | 1.0 | 2.0 | 23 Oct 2024 | On Market |
| Unit 2, 1539 David Low Way | $801,000 | 2.0 | 1.0 | 2.0 | 23 Oct 2024 | On Market |
| Unit 2, 1539 David Low Way | $801,000 | 2.0 | 1.0 | 2.0 | 23 Oct 2024 | On Market |
| Unit 2, 1539 David Low Way | $801,000 | 2.0 | 1.0 | 2.0 | 23 Oct 2024 | On Market |
| Unit 2, 1539 David Low Way | $801,000 | 2.0 | 1.0 | 2.0 | 23 Oct 2024 | On Market |
Loading entities ..