.png)
Profiles
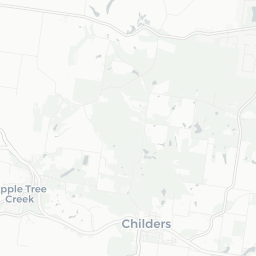
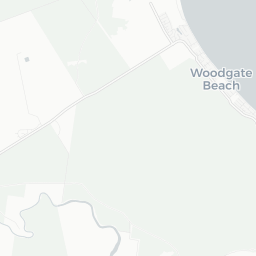
Nearby Suburbs
Real Estate Market: Is Redridge QLD 4660 a Good Suburb to Buy Into?
Housing Market in Redridge

Sources: Property Listings and Microburbs, 2002 - 2023
| Field | Value | VS Wide Bay | Trend | |
|---|---|---|---|---|
| Premium | Premium | Premium | ||
| Premium | Premium | Premium | ||
| Premium | Premium | Premium | ||
| $589 | Bottom 47% |
|
||
| Premium | Premium | Premium |
Housing Supply in Redridge

The higher the supply score the more supply is on the market, both current and future.
Sources: ABS, GEOSPATIAL, Property Listings, PLANNING ALERTS and Microburbs, 2002 - 2023
Sources: ABS, GEOSPATIAL, Property Listings, PLANNING ALERTS and Microburbs, 2002 - 2023
Redridge
40.6%
Redridge
40.6%
Wide Bay
40.0%
Wide Bay
40.0%
| Field | Value | VS Wide Bay | Trend | |
|---|---|---|---|---|
| 0 | Bottom 38% | Data for Jun 2025 | ||
| 0.6 | Bottom 29% | Data for Jul 2023 | ||
| Premium | Premium | Premium | ||
| Premium | Premium | Premium | ||
| Premium | Premium | Premium | ||
| 82 lots | Top 4% |
|
||
| Premium | Premium | Premium | ||
| Premium | Premium | Premium | ||
| 3 | Top 28% |
|
Housing Stock Quality in Redridge
The higher the score, the higher the quality of the houses and units.
Sources: ABS, GEOSPATIAL, Property Listings and Microburbs, 2006 - 2023
Sources: ABS, GEOSPATIAL, Property Listings and Microburbs, 2006 - 2023
| Field | Value | VS Wide Bay | Trend | |
|---|---|---|---|---|
| 100.0% | Top 31% |
|
||
| 2.3 | Bottom 34% |
|
||
| 0.0% | Bottom 37% | Data for Jun 2023 |
Development Restrictions in Redridge

The higher the score, the more easily density can be increased.
Sources: GEOSPATIAL, TORREN, ABS and Microburbs, 2011 - 2023
Sources: GEOSPATIAL, TORREN, ABS and Microburbs, 2011 - 2023
Redridge
31.5%
Redridge
31.5%
Wide Bay
35.5%
Wide Bay
35.5%
| Field | Value | VS Wide Bay | Trend | |
|---|---|---|---|---|
| 45.0 sq km | Top 23% | Data for Jan 2021 | ||
| 0.0 sq km | Bottom 39% | Data for Jun 2023 | ||
| 9570 sqm per resident | Top 17% | Data for Jan 2021 |
Risk in Redridge

The higher the score, the more exposed households are to financial stress.
Sources: ABS, Property Listings, TORREN and Microburbs, 2006 - 2023
Sources: ABS, Property Listings, TORREN and Microburbs, 2006 - 2023
Redridge
46.0
Redridge
46.0
Wide Bay
44.0
Wide Bay
44.0
| Field | Value | VS Wide Bay | Trend | |
|---|---|---|---|---|
| 96.8% | Top 30% |
|
||
| 3.2% | Bottom 30% |
|
||
| 33 | Top 47% | Data for Jun 2023 | ||
| $1,240 | Bottom 17% |
|
||
| 69 | Bottom 11% | Data for Jun 2023 | ||
| 68 | Bottom 14% | Data for Jun 2023 | ||
| 32.2% | Top 11% |
|
||
| 37.1% | Bottom 46% |
|
Housing Demand in Redridge
The higher the score, the more demand their is for housing in the area, both current and future.
Sources: ABS, TORREN, Property Listings and Microburbs, 2006 - 2030
Sources: ABS, TORREN, Property Listings and Microburbs, 2006 - 2030
Redridge
52.3%
Redridge
52.3%
Wide Bay
53.8%
Wide Bay
53.8%
| Field | Value | VS Wide Bay | Trend | |
|---|---|---|---|---|
| Premium | Premium | Premium | ||
| Premium | Premium | Premium | ||
| 11700 | Top 37% |
|
||
| 98500 | Top 29% |
|
||
| Premium | Premium | Premium | ||
| 103000 | Top 16% |
|
||
| Premium | Premium | Premium | ||
| Premium | Premium | Premium | ||
| Premium | Premium | Premium |
Unit Market in Redridge
Sources: Property Listings and Microburbs, 2002 - 2023
| Field | Value | VS Wide Bay | Trend | |
|---|---|---|---|---|
| Premium | Premium | Premium | ||
| $440 | Bottom 35% |
|
||
| Premium | Premium | Premium | ||
| 87.9% | Top 20% |
|
LGA Details (1)
| Headline | Place | Datetime |
|---|---|---|
| Local government area | Bundaberg |
Recently Sold Houses (100)
| Address | Price | Bedrooms | Bathrooms | Garage spaces | Date sold | Subdivisible into | Sale Type |
|---|---|---|---|---|---|---|---|
| 75 Sunnybrae Circuit | $665,775 | 3.0 | 1.0 | 4.0 | 07 Apr 2025 | 0 | On Market |
| 34 Gregory Dr | $607,000 | 3.0 | 1.0 | 4.0 | 31 Mar 2025 | 0 | On Market |
| 44 Grevillea Dr | $880,000 | 3.0 | 3.0 | 7.0 | 27 Mar 2025 | 0 | On Market |
| 1474 Goodwood Rd | $410,000 | 0.0 | 0.0 | 0.0 | 10 Feb 2025 | 0 | On Market |
| 1364 Goodwood Rd | $640,000 | 3.0 | 2.0 | 13.0 | 19 Dec 2024 | 0 | On Market |
Businesses (1)
| Name | Address |
|---|---|
| Paverock Quarry | 1485, Goodwood Rd |
Percent of Renters by Street (30)
| Percent of Renters | Street |
|---|---|
| 7.8% | Blue Gum Dr |
| 0.0% | Campaninis Rd |
| 0.0% | Clearview Ct |
| 0.0% | Coach Rd |
| 0.0% | Flynn Dr |
Turnover Rate by Street (30)
| Turnover rate | Street | Turnover Label | Turnover Years | Year |
|---|---|---|---|---|
| 68.8% | Gregory Dr | average turnover | Every 14.5 years (average turnover) | 2025 |
| 100.0% | Smiths Rd | high turnover | Every 10.0 years (high turnover) | 2025 |
| 100.0% | Gastons Rd | high turnover | Every 10.0 years (high turnover) | 2025 |
| 117.6% | Yalla Ln | very high turnover | Every 8.5 years (very high turnover) | 2025 |
| 110.0% | Mullers Rd | very high turnover | Every 9.1 years (very high turnover) | 2025 |
Planning Applications: Other (1)
| Headline | Place | Date |
|---|---|---|
| Extension of Time (MCU & ROL) - Bundaberg Regional Council 527.2021.85.1 | 948 Goodwood Rd, Redridge 4660 QLD | 19 Nov 2021 |
Planning Applications: Dwellings (2)
| Headline | Place | Date |
|---|---|---|
| Amenity and Aesthetics (Removal Dwelling) - Bundaberg Regional Council 532.2021.1231.1 | 19 Gastons Rd, Redridge 4660 QLD | 03 Feb 2021 |
| Amenity & Aesthetics & Security Assessment (Dwelling) - Bundaberg Regional Council 532.2020.1032.1 | 70 Gregory Dr, Redridge 4660 QLD | 03 Sep 2020 |
Median House Sale Prices by Street (100)
| Street | Date | Median sale value |
|---|---|---|
| One World Dr | 10 May 2024 | $605,000 |
| Mullers Rd | 10 May 2024 | $460,000 |
| Sunnybrae Cct | 10 May 2024 | $620,000 |
| Melaleuca Ct | 10 May 2024 | $665,000 |
| Blue Gum Dr | 06 Oct 2023 | $743,900 |
Recent Rental House Listings (100)
| Address | Rent (per week) | Bedrooms | Bathrooms | Garage spaces | Date | Subdivisible into |
|---|---|---|---|---|---|---|
| 1 Melaleuca Ct | $650 | 3 | 2 | 4 | 14 Apr 2025 | 0 |
| 1 Melaleuca Ct | $650 | 3 | 2 | 4 | 14 Apr 2025 | 0 |
| 131 Sunnybrae Circuit | $550 | 3 | 2 | 5 | 15 Aug 2024 | 0 |
| 131 Sunnybrae Circuit | $550 | 3 | 2 | 5 | 15 Aug 2024 | 0 |
| 131 Sunnybrae Circuit | $550 | 3 | 2 | 5 | 15 Aug 2024 | 0 |
Recently Sold Units (100)
| Address | Price | Bedrooms | Bathrooms | Garage spaces | Date sold | Sale Type |
|---|---|---|---|---|---|---|
| 1474 Goodwood Rd | $410,000 | 0.0 | 0.0 | 0.0 | 10 Feb 2025 | On Market |
| 1474 Goodwood Rd | $410,000 | 0.0 | 0.0 | 0.0 | 10 Feb 2025 | On Market |
| 1474 Goodwood Rd | $410,000 | 0.0 | 0.0 | 0.0 | 10 Feb 2025 | On Market |
| 1474 Goodwood Rd | $410,000 | 0.0 | 0.0 | 0.0 | 10 Feb 2025 | On Market |
| 1474 Goodwood Rd | $410,000 | 0.0 | 0.0 | 0.0 | 10 Feb 2025 | On Market |
Recent Rental Unit Listings (100)
| Address | Rent (per week) | Bedrooms | Bathrooms | Garage spaces | Date |
|---|---|---|---|---|---|
| 4 Mullers Rd | $260 | 06 Jun 2018 | |||
| 4 Mullers Rd | $260 | 06 Jun 2018 | |||
| 4 Mullers Rd | $260 | 06 Jun 2018 | |||
| 4 Mullers Rd | $260 | 06 Jun 2018 | |||
| 4 Mullers Rd | $260 | 06 Jun 2018 |
Loading entities ..